


Imperial Oil (TSX:IMO) Stock Looks Stretched On Its Very Large 5 Year Run
Imperial Oil stock has delivered a very large 5 year return, yet its valuation signals are split, with a Discounted Cash Flow (DCF) estimate pointing to meaningful upside while earnings based multiples suggest the shares are already priced generously.
- Imperial Oil has returned roughly 4.8x over 5 years, which puts added focus on whether current buyers are paying too much for past success.
- New projects and capacity such as the planned West Coast Oil Pipeline and related emission reduction commitments can support future cash flows, but the market may reassess the stock if expectations for earnings growth or capital returns soften.
- On Simply Wall St’s broader checks, Imperial Oil screens as attractive on only 2 of 6 valuation measures, so overall it leans more expensive than cheap.
The issue now is whether Imperial Oil’s current share price leaves enough margin of safety when the intrinsic value estimate and market multiples are telling different stories about what the stock is worth.
Is Imperial Oil a Bargain on Cash Flow?
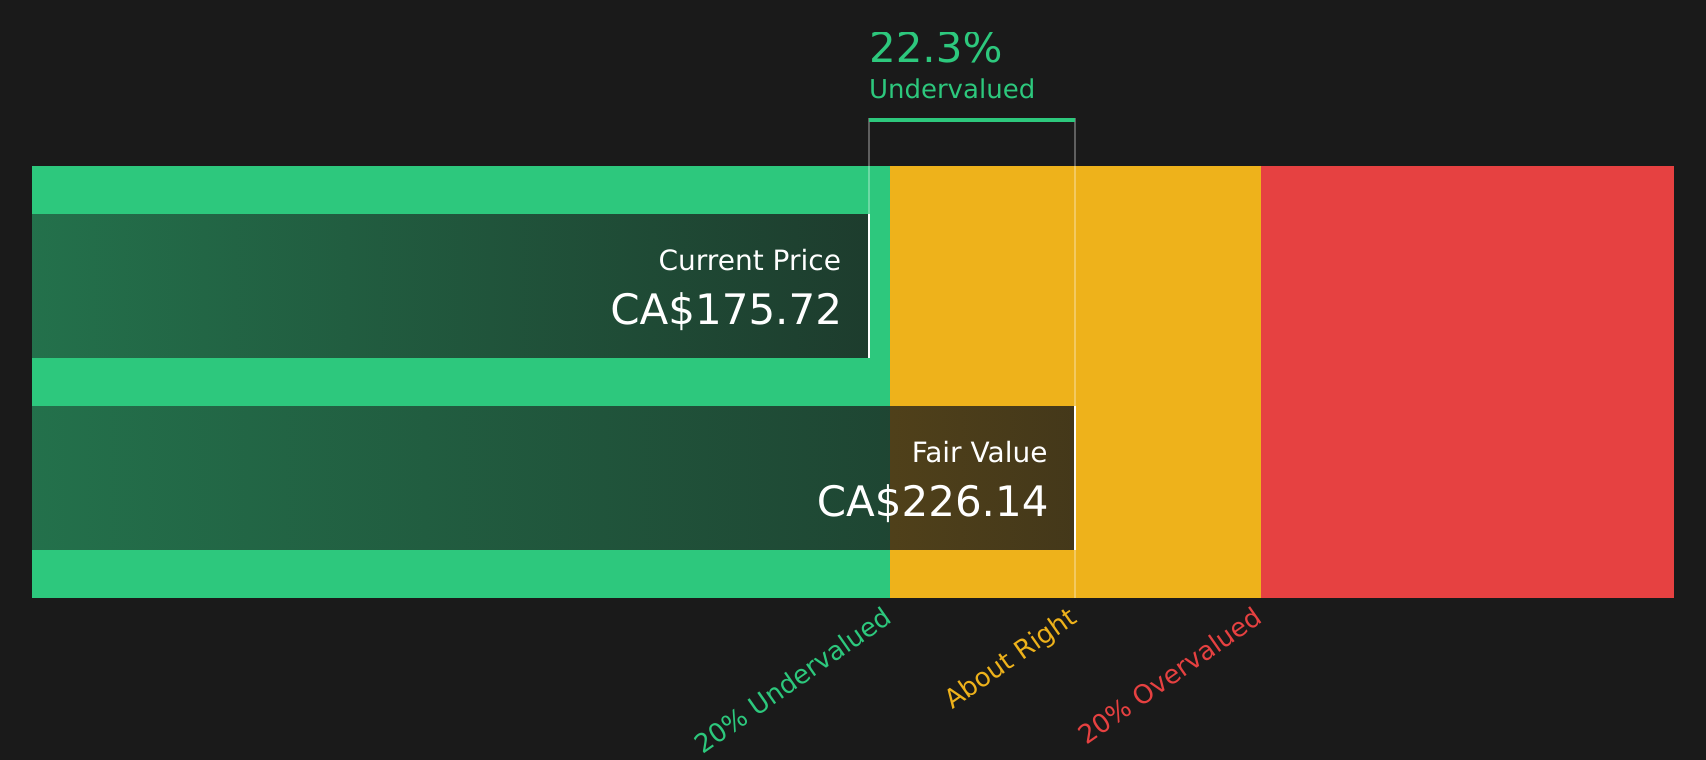
The Discounted Cash Flow (DCF) model looks at the cash Imperial Oil can generate for shareholders and discounts it back to today. Imperial Oil’s latest twelve month free cash flow sits at about CA$4.1b, and the model assumes cash flows broadly growing from this base rather than shrinking. On these inputs, the 2 Stage Free Cash Flow to Equity model arrives at an estimated intrinsic value of about CA$239 per share.
Compared with the current share price, that intrinsic value suggests the stock screens roughly 28.1% undervalued on a cash flow basis. The recently approved share buyback of up to 5% of outstanding shares helps explain why the DCF points to value that the market price has not fully reflected, because retiring stock can concentrate those future cash flows across fewer shares. Overall, the DCF workup indicates Imperial Oil appears undervalued relative to what its projected cash generation supports.
Our Discounted Cash Flow (DCF) analysis suggests Imperial Oil is undervalued by 28.1%. Track this in your watchlist or portfolio, or discover 5 more high quality undervalued stocks.
Does Imperial Oil Look Pricey on Earnings?
P/E is a useful lens for Imperial Oil because it connects what you pay today with the company’s current earnings power. Imperial Oil trades at about 28.5x earnings, compared with an Oil and Gas industry average P/E of roughly 24.2x and a peer group average near 18.2x. As a result, the stock already carries a clear premium to both its sector and closer comparables.
The fair P/E ratio implied by the model is about 21.4x, which is lower than where Imperial Oil is currently priced. That gap indicates investors are paying more relative to what the company’s growth profile, margins, size and risk would typically justify on this framework, even after factoring in its capital return plans and established operations.
On this earnings multiple, Imperial Oil stock appears overvalued relative to what its fundamentals would usually support.

See what the numbers say about this price — find out in our valuation breakdown.
The Imperial Oil Narrative: What Would Justify Today's Price?
Simply Wall St Narratives pick up where Imperial Oil's conflicting DCF and P/E signals leave off by spelling out which assumptions about Imperial Oil's future growth, margins and earnings would need to hold for the current stock price to look meaningfully higher or lower. Each Narrative presents Imperial Oil's fair value as a concrete thesis about the business that you can revisit over time, and they are available on Simply Wall St's Community page.
Imperial Oil attracts sharply different community views, with one camp leaning on cash return potential and another focused on energy transition and valuation risk.
Bull case: 16% undervalued
"Analysts broadly agree ongoing technology adoption will lower operating costs, but they may be underestimating the compounding impact of fully-autonomous mining, AI-driven plant optimization and solvent-assisted processes..."
Read the full Bull Case to see why Imperial Oil could be undervalued
Bear case: 12% overvalued
"Imperial Oil remains highly exposed to long-term decarbonization and energy transition risk, as the company's core assets and growth initiatives continue to center on oil sands..."
Read the full Bear Case to see why Imperial Oil could be overvalued
Do you think there's more to the story for Imperial Oil? Head over to our Community to see what others are saying!
The Bottom Line
For Imperial Oil, the Discounted Cash Flow (DCF) work points to meaningful undervaluation, while the earnings multiple view flags the stock as overvalued relative to peers. That split largely reflects a market that is already paying up for recent earnings and sentiment after a very large multi year move, while the intrinsic value estimate focuses on the cash that could still be returned to shareholders.
Broader valuation checks remain weak overall, so the key question from here is whether Imperial Oil’s cash generation and capital returns justify the current premium P/E, or whether the market is correctly pricing in longer term energy transition and project execution risks.
This article by Simply Wall St is general in nature. We provide commentary based on historical data and analyst forecasts only using an unbiased methodology and our articles are not intended to be financial advice. It does not constitute a recommendation to buy or sell any stock, and does not take account of your objectives, or your financial situation. We aim to bring you long-term focused analysis driven by fundamental data. Note that our analysis may not factor in the latest price-sensitive company announcements or qualitative material. Simply Wall St has no position in any stocks mentioned.
Have feedback on this article? Concerned about the content? Get in touch with us directly. Alternatively, email editorial-team@simplywallst.com