


Renault (ENXTPA:RNO) Stock Looks Undervalued After Its 33% One Year Fall
Renault’s share price has fallen sharply over the past year, yet its current market price sits well below an intrinsic value estimate based on a Discounted Cash Flow (DCF) approach, with market multiples pointing in the same undervalued direction.
- Renault stock is down 32.6% over the past year, which has increased investor focus on whether the current price already reflects the bad news.
- The recent High Court ruling in England & Wales in favor of Renault on diesel emissions litigation may support sentiment around legal and compliance risks. However, any renewed concerns about future legal or regulatory actions could still weigh on how investors price the stock.
- Renault screens as undervalued on 5 of 6 valuation checks, so the broader picture leans cheap rather than fully priced, according to its value score of 5.
The issue now is whether Renault’s current discount to intrinsic value and valuation multiples offers a margin of safety that compensates for the risks still facing the business.
Find out why Renault's -32.6% return over the last year is lagging behind its peers.
Is Renault a Bargain on Cash Flow?
The Discounted Cash Flow (DCF) model takes Renault’s projected future cash flows and discounts them back to what they might be worth today. For Renault, the latest twelve month free cash flow shows an outflow of about €794 million, yet the model assumes cash flows recover to positive levels over time, based on analyst and trend projections.
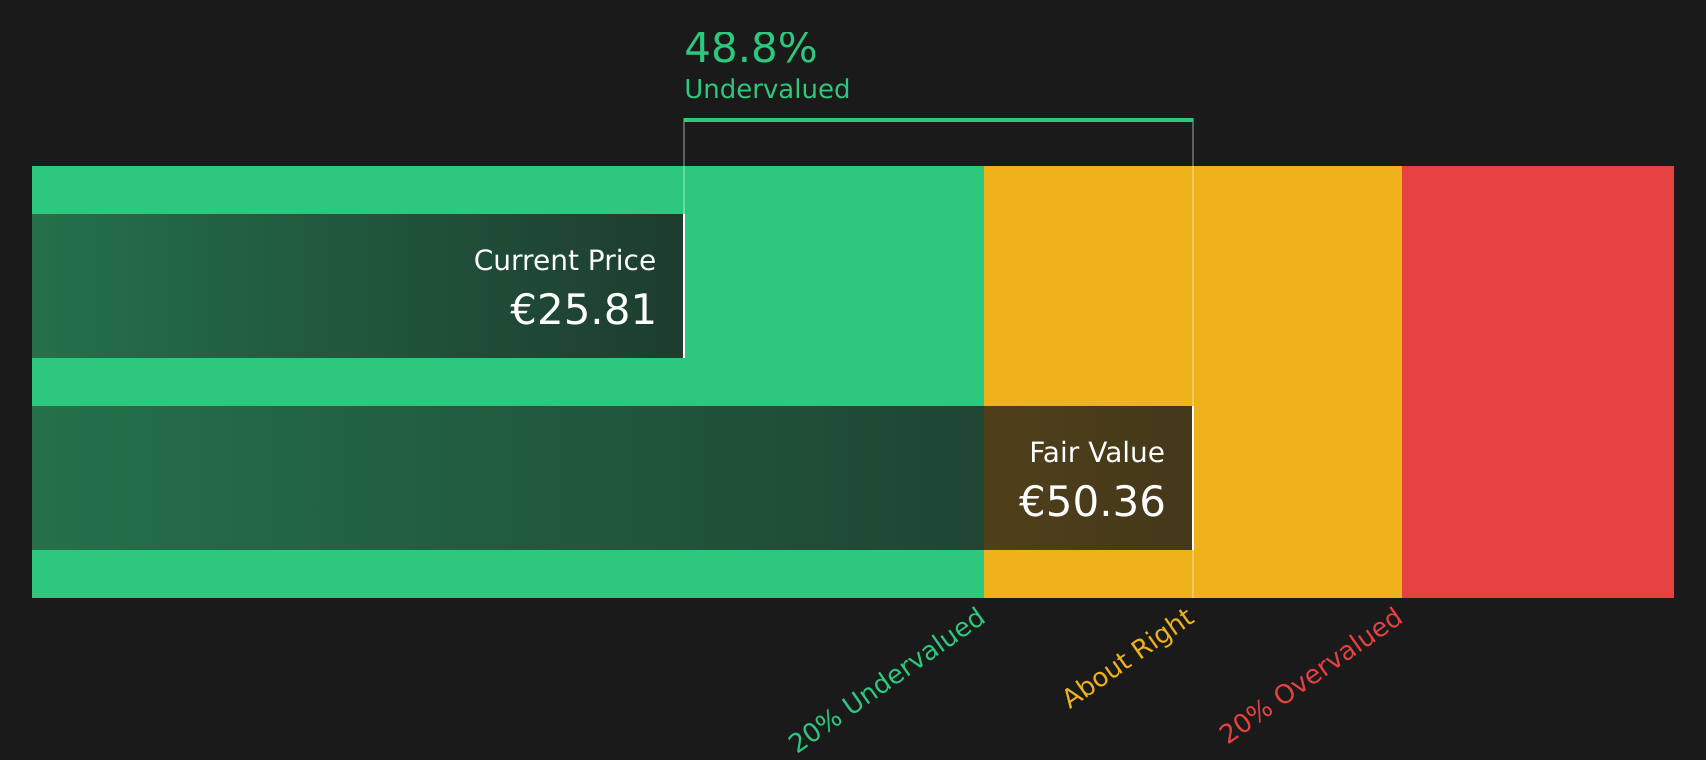
On those assumptions, the DCF points to an estimated intrinsic value of about €50.36 per share, which sits well above the current market price and implies the stock trades at a 48.8% discount. Because the recent High Court ruling on diesel emissions went in Renault’s favor, any legal overhang from this case appears less severe than some investors may have feared. However, the share price still sits below what the cash flow projections suggest.
Putting it together, the DCF workup indicates Renault stock currently looks undervalued relative to its projected cash flows.
Our Discounted Cash Flow (DCF) analysis suggests Renault is undervalued by 48.8%. Track this in your watchlist or portfolio, or discover 211 more high quality undervalued stocks.
Is Renault Still Cheap on Sales?
For Renault, the P/S multiple is a useful cross check because revenue is less affected by swings in earnings than ratios like P/E. The stock trades on a P/S of about 0.1x, compared with an Auto industry average of roughly 0.6x and a peer group average of about 0.5x. This means the market is pricing Renault’s sales at a lower level than many competitors.
The fair P/S ratio from the model is around 0.2x, which is still above the current level and indicates a gap between what investors are currently paying for each euro of Renault’s revenue and what might be expected given its profile. Taken together with the DCF work, this suggests the share price reflects a cautious view of the business even though the stock already trades at a sizable discount on sales.
On this P/S measure, Renault stock appears undervalued relative to both its tailored fair multiple and its Auto industry peers.

See what the numbers say about this price — find out in our valuation breakdown.
The Renault Narrative: What Would Justify Today's Price?
Simply Wall St Narratives for Renault pick up where the valuation work above leaves off by spelling out the specific paths for Renault’s growth, margins and earnings that would make the stock worth materially more or less than today’s price on the market. Instead of stopping at a single output from a ratio or model, they unpack the future business conditions that figure depends on so you can watch how closely reality tracks those underlying assumptions on Simply Wall St’s Community page.
One of the top community narratives on Renault: 47% undervalued
"Additionally, RNO is the only European OEM in the car industry with a barrage of launches across price segments in the EV market, thus opening up opportunities missed by, e.g., Volkswagen or BMW..."
Read one of the top narratives on Renault
Do you think there's more to the story for Renault? Head over to our Community to see what others are saying!
The Bottom Line
Renault screens as undervalued on both the Discounted Cash Flow (DCF) intrinsic value estimate and its sales multiple, so the current price already bakes in a cautious view of the business. With several valuation tools pointing in the same direction, the key question is whether the legal and execution risks highlighted earlier justify such a wide discount or leave room for a reassessment over time. For you as an investor, the crux is whether Renault can deliver on the cash flow and revenue profile embedded in those models, or whether the market is correctly treating the stock as a potential value trap.
This article by Simply Wall St is general in nature. We provide commentary based on historical data and analyst forecasts only using an unbiased methodology and our articles are not intended to be financial advice. It does not constitute a recommendation to buy or sell any stock, and does not take account of your objectives, or your financial situation. We aim to bring you long-term focused analysis driven by fundamental data. Note that our analysis may not factor in the latest price-sensitive company announcements or qualitative material. Simply Wall St has no position in any stocks mentioned.
Have feedback on this article? Concerned about the content? Get in touch with us directly. Alternatively, email editorial-team@simplywallst.com