


70% of S&P 500 Tech Stocks Are Down 20% or More from Their All-Time Highs
Of the roughly 500 stocks in the S&P 500 Index ($SPX), about 72 are in the technology sector. Considering there are 11 sectors, and the average number of stocks per sector is 45, that means the S&P 500 is skewed toward tech.
Tech stocks continue to be the “anchor tenant” of the S&P 500, with a dominant 37% weighting. That’s more than the next three sectors – Financials, Communication Services, and Industrials – combined. In fact, you can even add up the bottom 7 sectors and still not reach the total weighting of tech.
Once we take a second to marvel at how well tech investing has done over the years, and the brute force with which its giant companies have taken over the S&P 500 index, there’s an issue to address. You see, many of those tech stocks are so big that if they falter, they are likely to take the index down with them.
And right now, 60% of tech stocks are currently in a “bear market” if we use the traditional definition. They are down 20% from their highs. That headline is an attention-grabber.
But I wanted to see if this is one of those skin-deep types of market wounds, or something bigger. Because in my view, if mega-cap tech stocks fall hard and don’t get up quickly, it is more likely to be other tech stocks, smaller ones, which pick up the slack.
The whole concept of a “broadening out” trade is frankly lost on me. Why? Because that’s what I see in the charts.
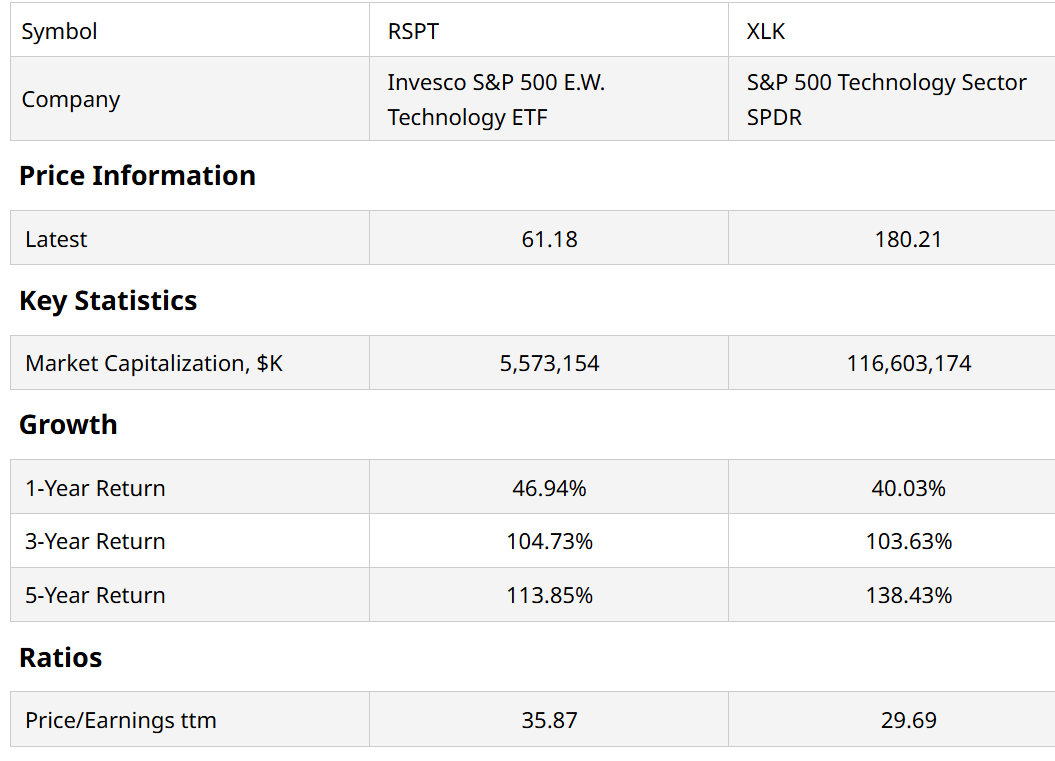
The other reason I say this is because of what we see above. For the past three years, the Invesco S&P 500 E.W. Technology ETF (RSPT), which tracks the average tech stock, has performed in line with the SPDR S&P 500 Technology Sector ETF (XLK), the one which has the three-headed monster of Apple (AAPL), Microsoft (MSFT), and Nvidia (NVDA) at the top.
The next few tiers down in market cap size need to be the reinforcements. But all they are doing recently is reinforcing the idea that it’s big tech or bust. The aforementioned data point, that 60% of those 70+ tech stocks within the S&P 500 are down at least 20% from their highs, has some uncomfortable roommates in the data point department. Here they are:
- 70% of those S&P 500 tech stocks are down more than 20% from their all-time highs, and half of those are off at least 35%.
- 40% of those stocks are down this year
- Over the past five years, every one of those 72 stocks has had a decline of at least 27%. More than half have lost at least 50% of their value at some point during the past five years.
- One out of four have lost at least two-thirds of their peak value at some point during that same 5-year period.
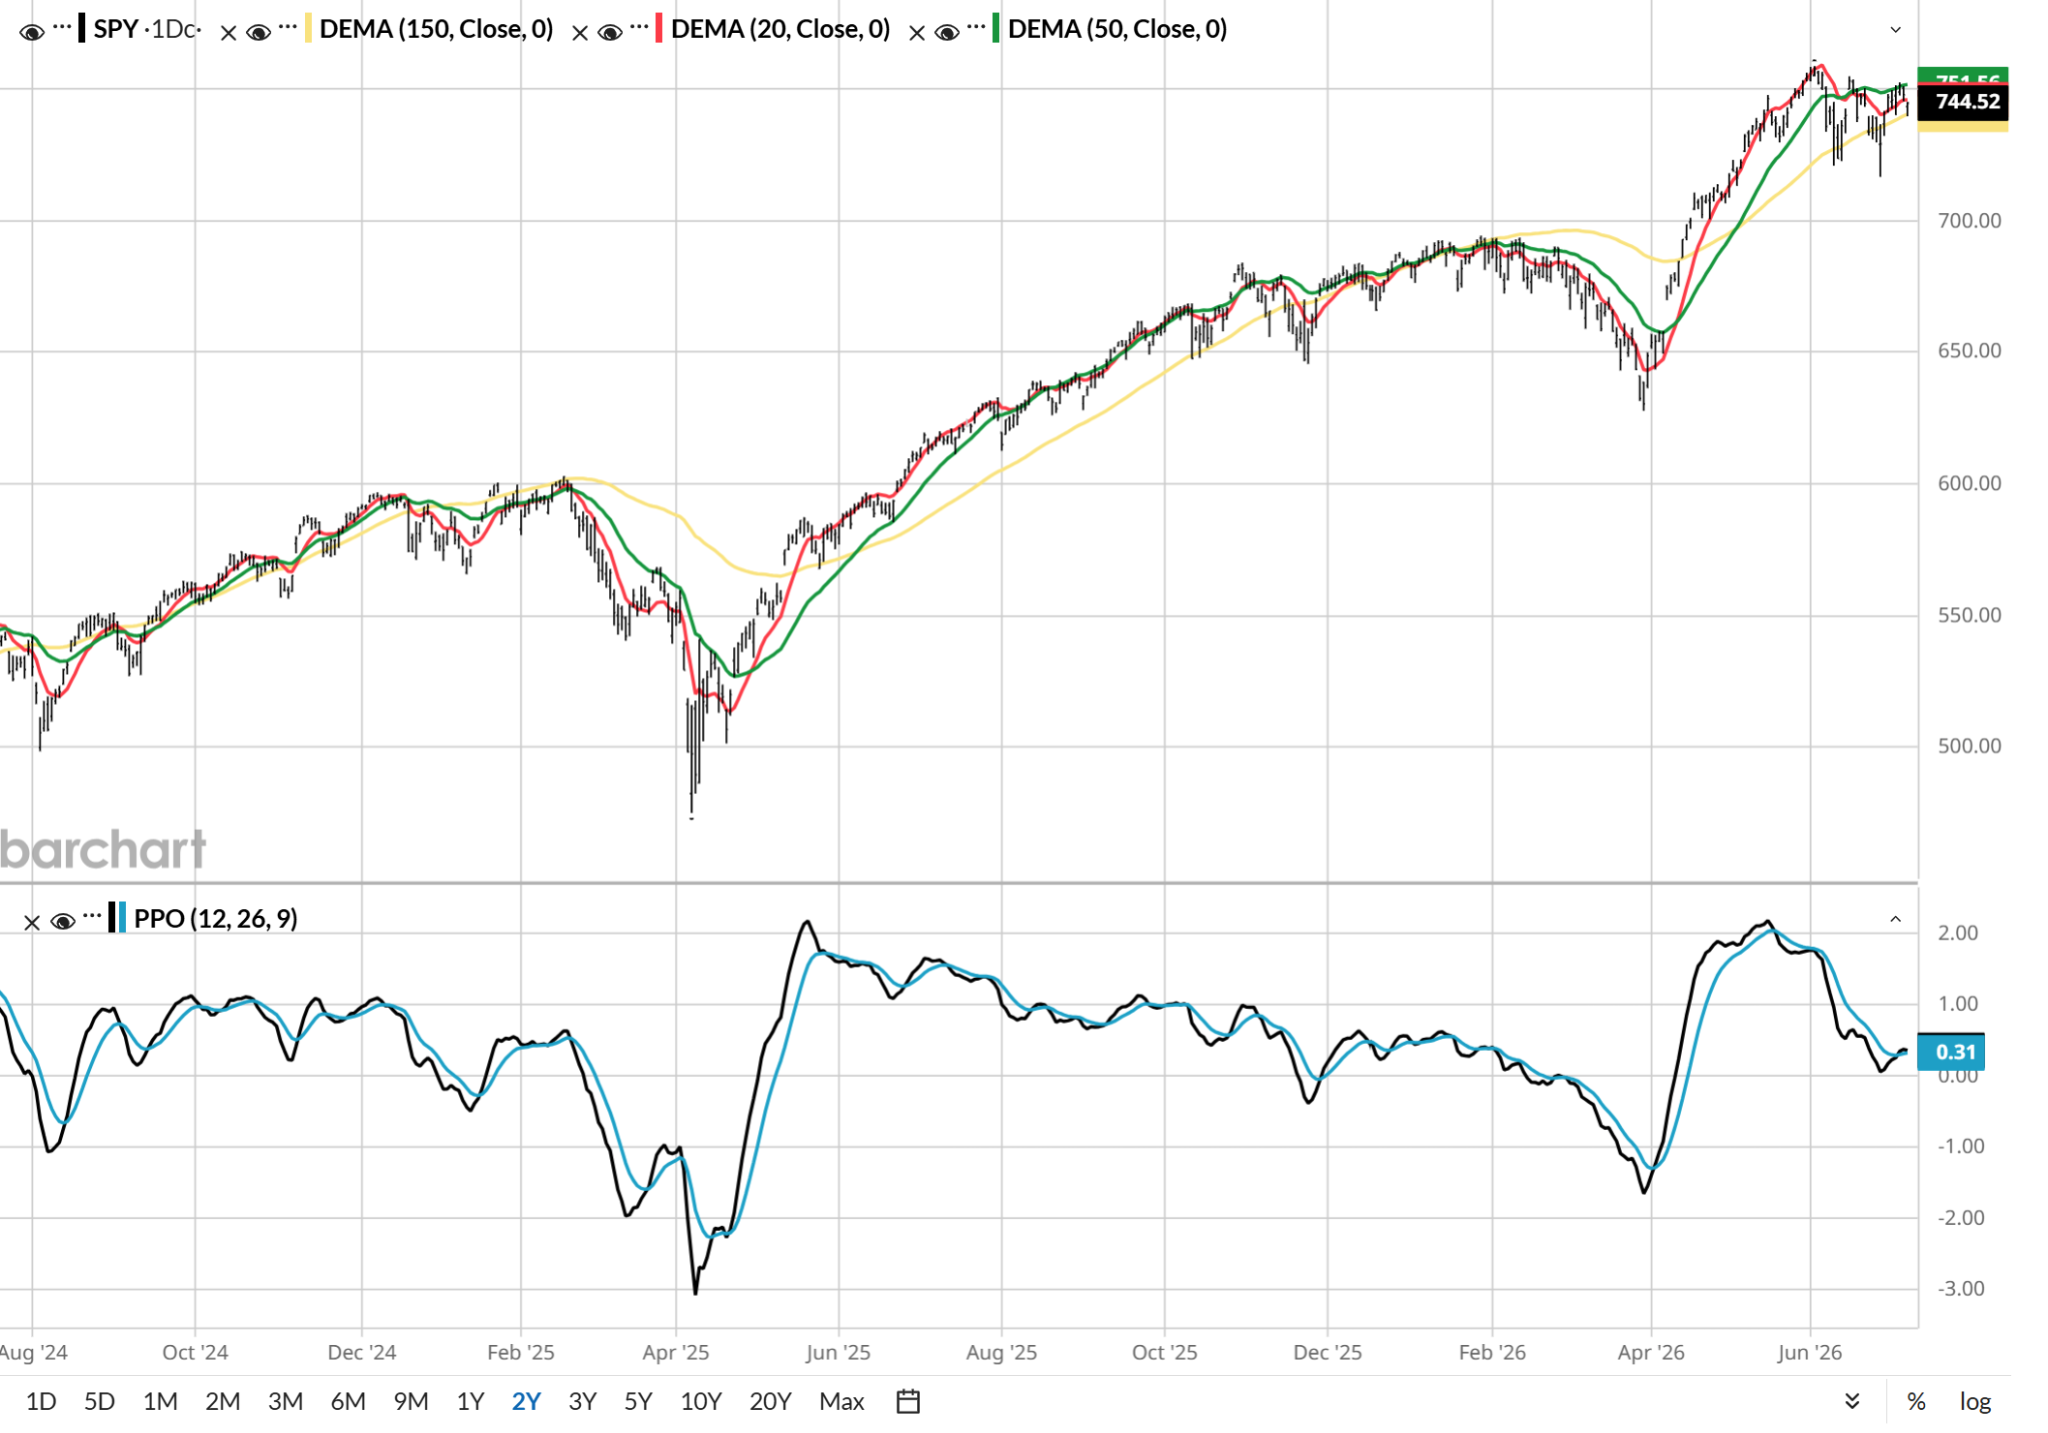
Taken together, that paints a picture of the sector, and by association a stock market, which is hanging on by a thread. That’s not a healthy market. And while this SPY chart is more indicative of a market still trying to grapple with this, as opposed to letting go and tanking, that latter scenario is increasing in likelihood.
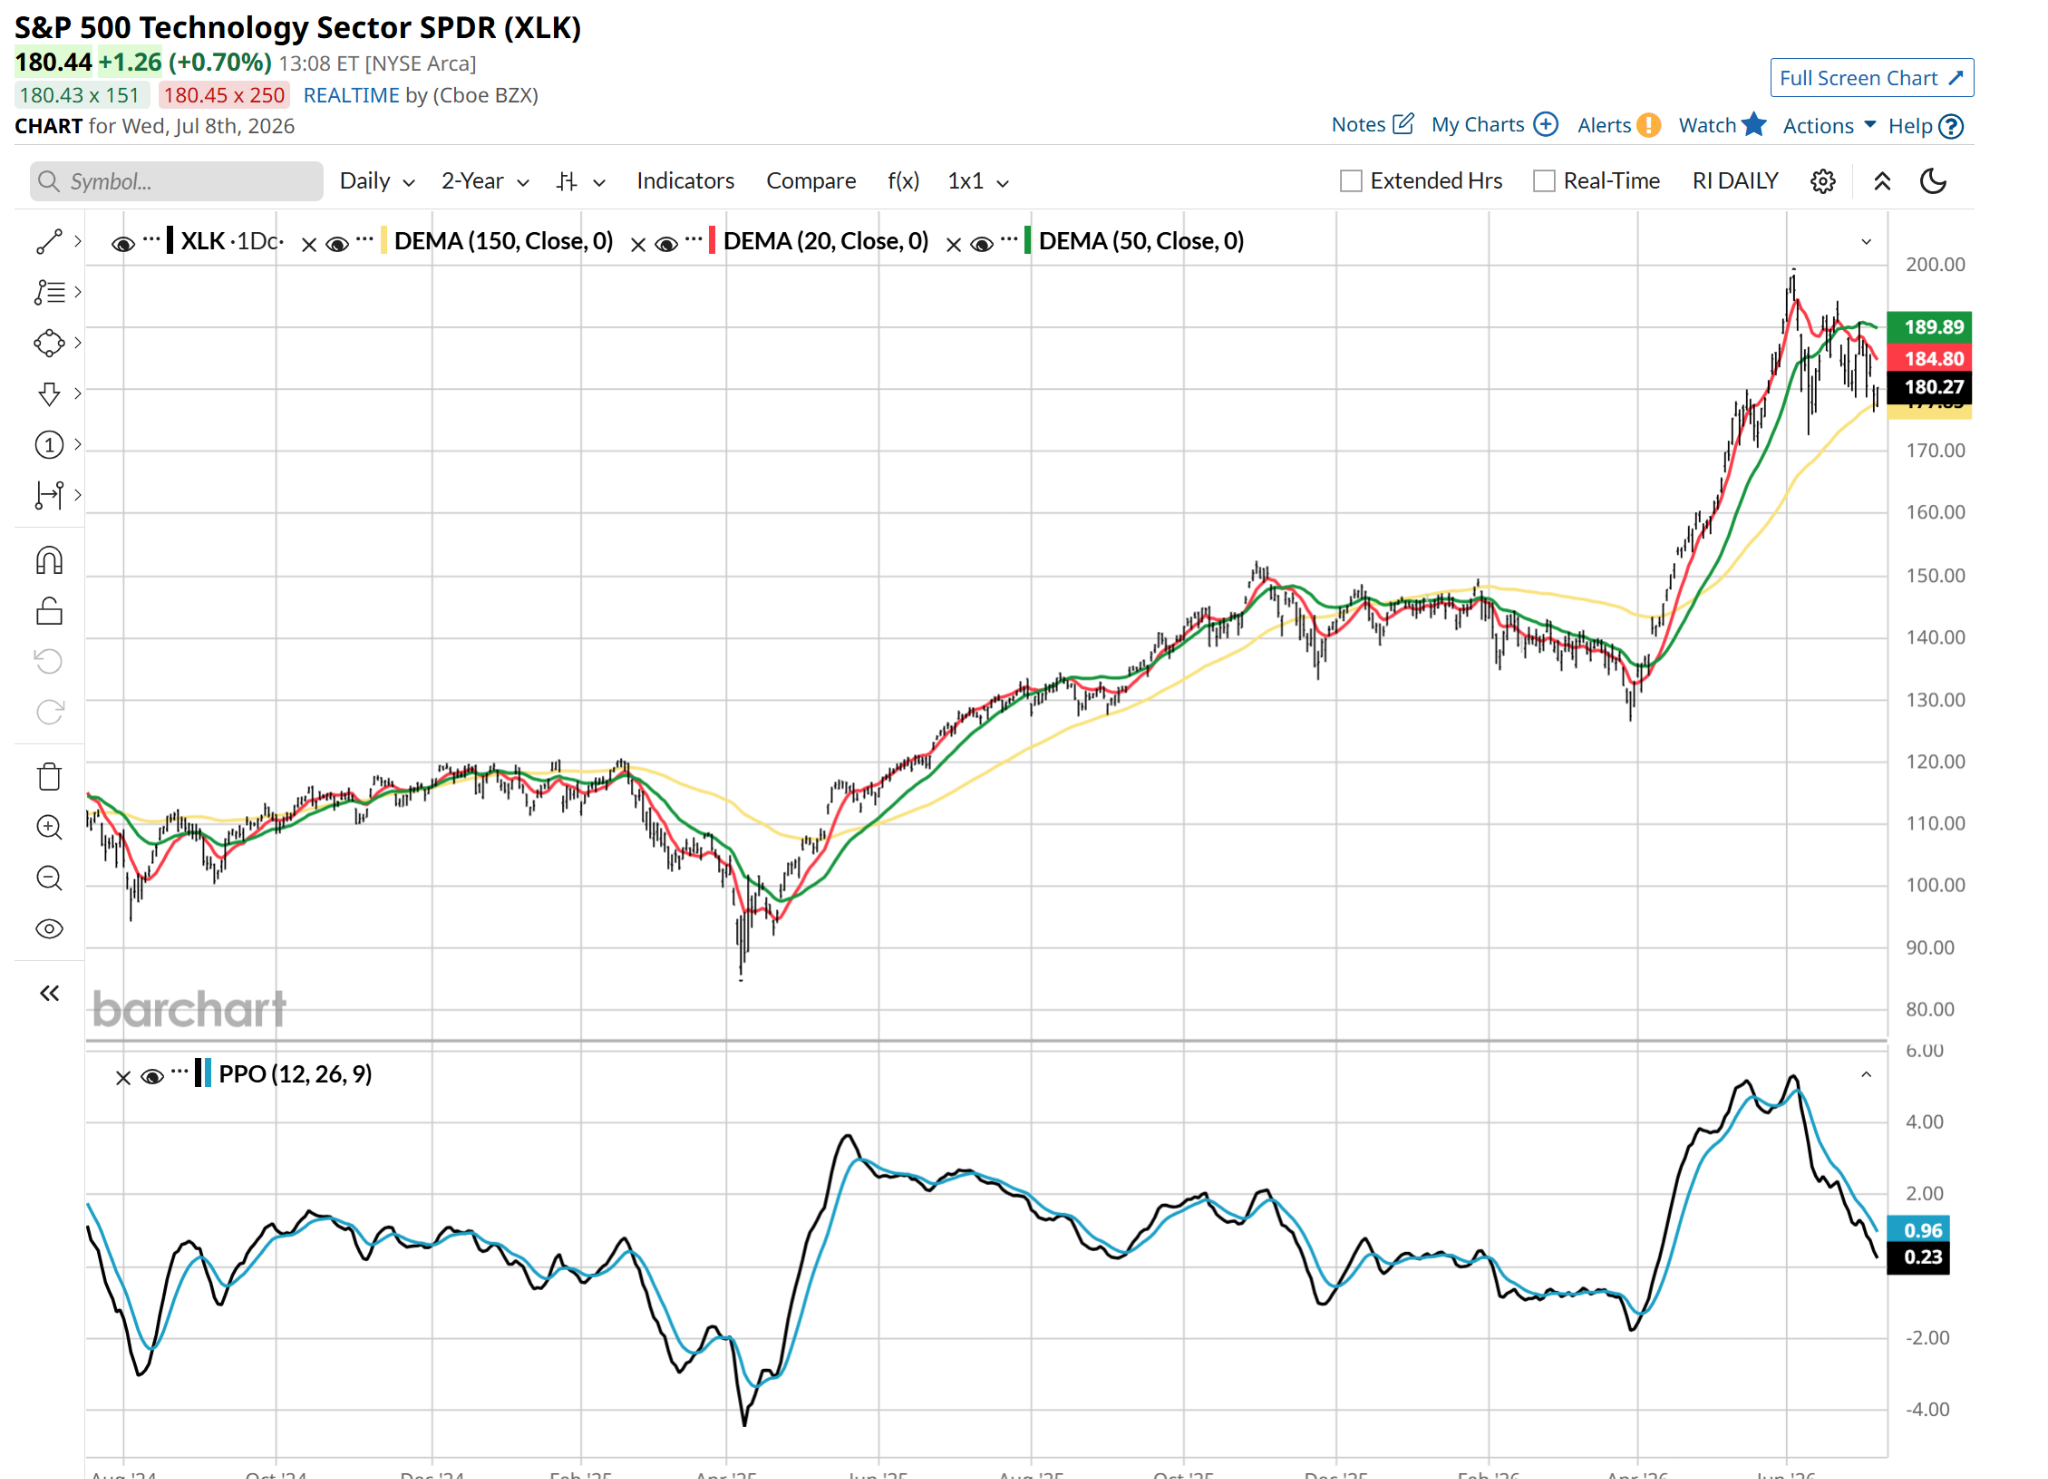
XLK’s chart, which of course is biased heavily toward the biggest names in the sector, has a clear message. As I read it, it has already moved one step further down the road of reversing its more-than-50% trough-to-peak move since just over three months ago. The bigger they rise, the harder they fall?
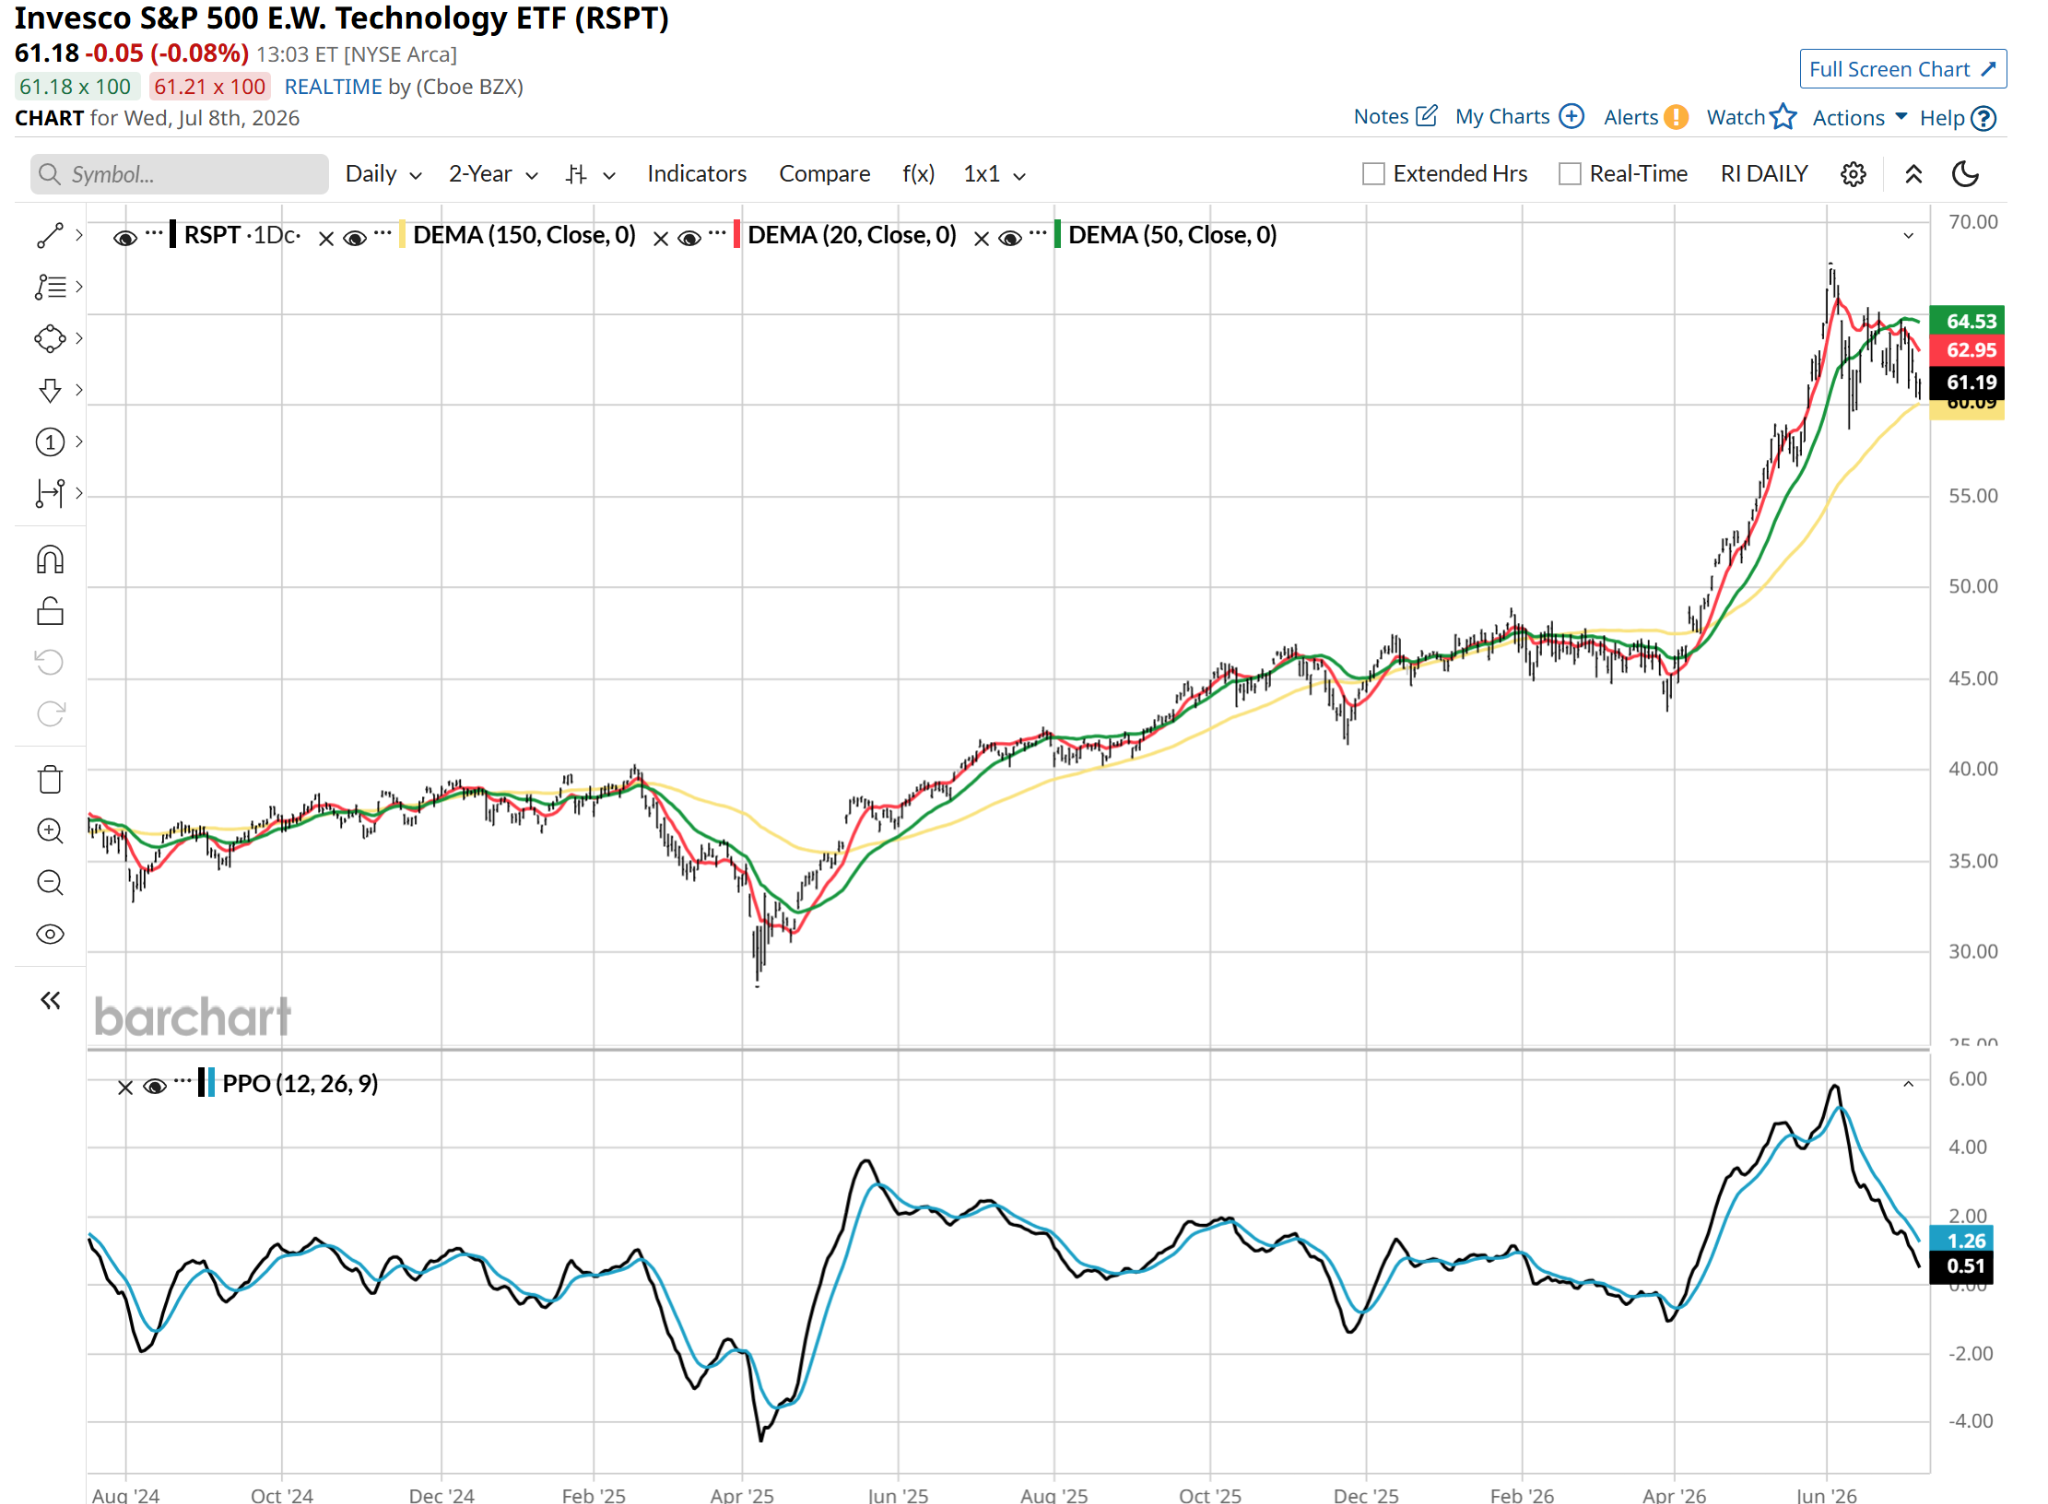
The “bailout” for tech here would be if there was a better technical picture by smoothing the weights, and viewing it via RSPT, which is an equal-weight S&P 500 tech stock index ETF. But it looks nearly identical to XLK.
This extreme split comes down to a direct divergence in how institutional money is moving. Big money desks are treating tech like a zero-sum game. They are aggressively pulling cash out of everyday software, networking, and secondary tech stocks, and piling all of it into the absolute best growth spots in the semiconductor hardware space.
This all serves to create a highly risky setup for index investors. For the broad tech sector to hold up, the small handful of stalling mega-cap titans must deliver impossible, flawless growth quarter after quarter just to keep their share prices from falling.
The moment those massive names experience a minor earnings slowdown, there is no solid foundation underneath to catch the index. The other 60% of the tech sector has already been thoroughly sold down and starved of institutional cash.
When well over half of a sector is trapped in a deep drawdown, the high headline averages aren’t a sign of strong sector health. Instead, they are more likely a clear warning that the entire tech market is vulnerable to a massive catch-down drop.
Rob Isbitts is a semi-retired CIO, former fiduciary investment advisor, and Barchart columnist. Check out his other work at ETFYourself.com (featuring the Fresh Charts weekly trading post), and ROAR.PiTrade.com, helping investors to better-manage their own portfolios.
On the date of publication, Rob Isbitts did not have (either directly or indirectly) positions in any of the securities mentioned in this article. All information and data in this article is solely for informational purposes. For more information please view the Barchart Disclosure Policy here.