


Is It Time To Reassess Cadence Design Systems (CDNS) After Strong Multi‑Year Share Gains?
- If you are looking at Cadence Design Systems and wondering whether the current share price lines up with the underlying value, the numbers offer a few clear starting points to work from.
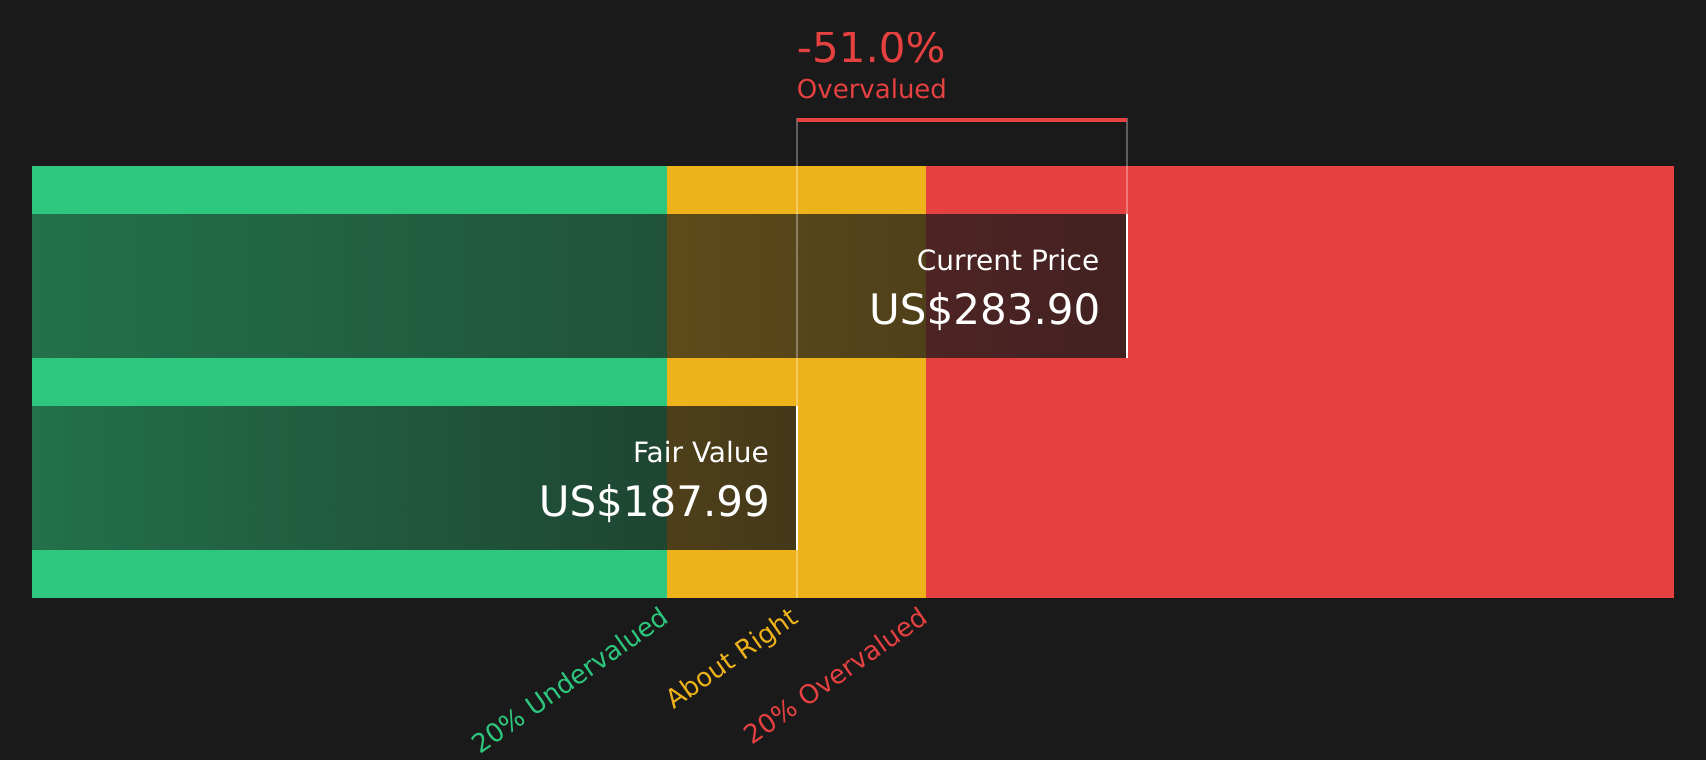
- The stock last closed at US$283.90, with returns of a 1.1% decline over 7 days, a 6.9% decline over 30 days, an 8.5% decline year to date, and gains of 8.2% over 1 year, 38.8% over 3 years, and 114.1% over 5 years.
- These mixed shorter term and longer term returns put more focus on how the current price compares to measures of value, such as earnings and cash flows. The upcoming sections will look at how simply measured valuation metrics line up with what is currently implied by the share price.
- Right now, Cadence Design Systems scores just 1 out of 6 on our valuation checks, so it helps to look at several methods side by side and then finish with a broader framework that can give an even richer view of what fair value might look like over time.
Cadence Design Systems scores just 1/6 on our valuation checks. See what other red flags we found in the full valuation breakdown.
Approach 1: Cadence Design Systems Discounted Cash Flow (DCF) Analysis
A Discounted Cash Flow, or DCF, model estimates what a business could be worth today by projecting future cash flows and discounting them back to the present. It is essentially asking what all of Cadence Design Systems future cash in US$ is worth in today’s terms.
Cadence Design Systems last twelve month free cash flow is about US$1.59b. Analyst and extrapolated projections used in the 2 Stage Free Cash Flow to Equity model show free cash flow figures between roughly US$1.79b and US$3.79b a year over the next decade, with US$2.54b projected for 2028. Simply Wall St uses analyst estimates where available and then extends the series to build a longer term cash flow path.
When these projected cash flows are discounted back, the model arrives at an estimated intrinsic value of US$187.90 per share. Against the recent share price of US$283.90, this implies the stock is around 51.1% above the DCF estimate, which points to Cadence Design Systems trading at a premium on this measure.
Result: OVERVALUED
Our Discounted Cash Flow (DCF) analysis suggests Cadence Design Systems may be overvalued by 51.1%. Discover 52 high quality undervalued stocks or create your own screener to find better value opportunities.
Approach 2: Cadence Design Systems Price vs Earnings
For a profitable company like Cadence Design Systems, the P/E ratio is a useful way to gauge what you are paying for each dollar of earnings. A higher P/E often reflects higher growth expectations or a lower perceived risk, while a lower P/E can reflect lower expected growth or higher risk.
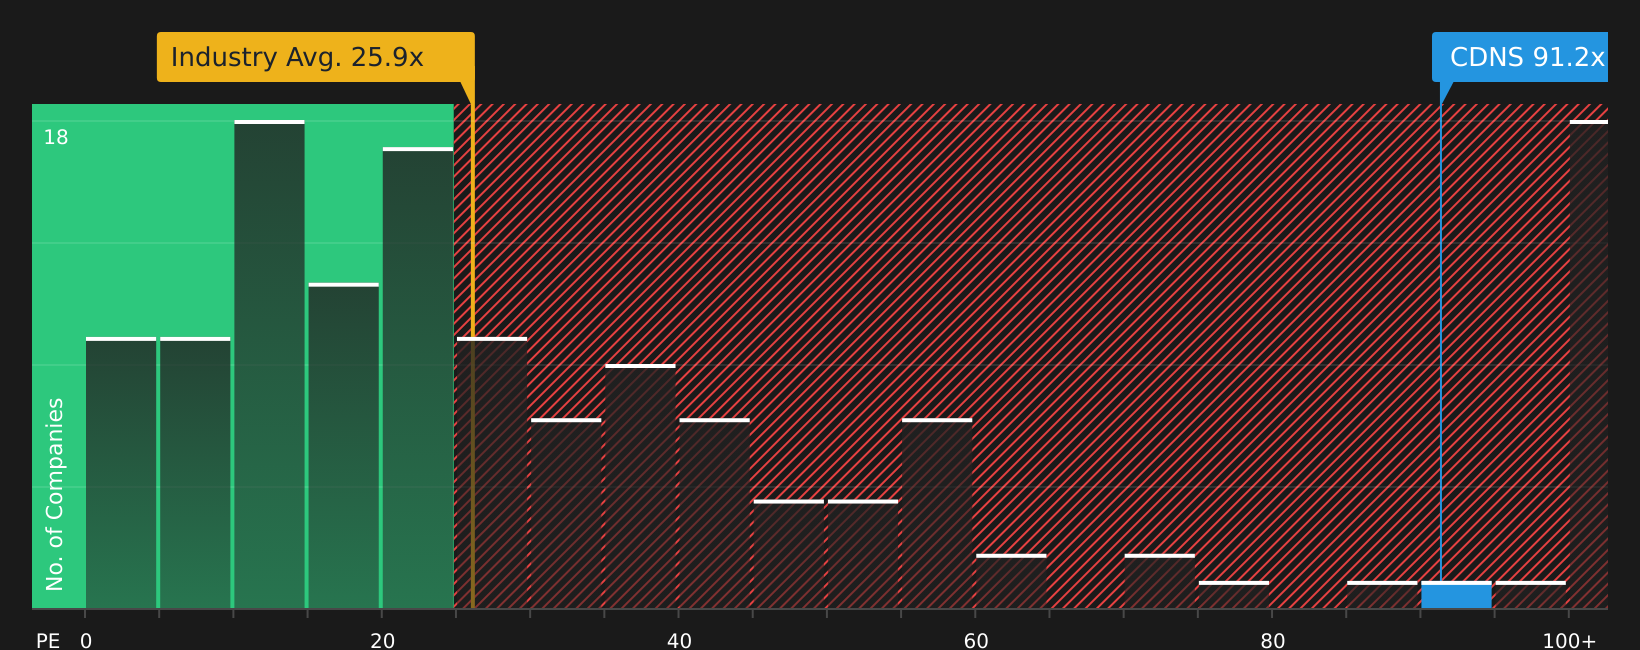
Cadence Design Systems currently trades on a P/E of 70.69x. That sits well above the broader Software industry average P/E of 29.37x and above the peer group average of 40.62x, so the stock is priced at a premium on this simple comparison.
Simply Wall St also calculates a proprietary “Fair Ratio” for the P/E, which for Cadence Design Systems is 39.29x. This Fair Ratio is designed to be a more tailored benchmark than industry or peer averages because it incorporates company specific factors such as earnings growth, profit margins, risk profile, industry and market cap. When the current P/E of 70.69x is set against the Fair Ratio of 39.29x, the shares look expensive on this metric.
Result: OVERVALUED
P/E ratios tell one story, but what if the real opportunity lies elsewhere? Start investing in legacies, not executives. Discover our 20 top founder-led companies.
Upgrade Your Decision Making: Choose your Cadence Design Systems Narrative
Earlier it was mentioned that there is an even better way to understand valuation. Narratives are introduced here as simple stories that you create about Cadence Design Systems, where your view on its business, revenue, earnings and margins is turned into a financial forecast and then into your own fair value that can be compared to the current price to help decide whether the stock looks attractive, fully priced or expensive.
On Simply Wall St, Narratives sit inside the Community page and are designed so that any investor can plug in assumptions without complex modeling, see an instant fair value output, and then watch that view update automatically when new data such as news, guidance or earnings is added.
For Cadence Design Systems, one investor might build a more optimistic Narrative that lines up with a fair value of about US$418.00 per share, while another might take a more cautious stance closer to US$278.62 per share. Seeing both side by side helps you decide which story about the company you find more reasonable and how closely the price on screen matches your own Narrative.
Do you think there's more to the story for Cadence Design Systems? Head over to our Community to see what others are saying!

This article by Simply Wall St is general in nature. We provide commentary based on historical data and analyst forecasts only using an unbiased methodology and our articles are not intended to be financial advice. It does not constitute a recommendation to buy or sell any stock, and does not take account of your objectives, or your financial situation. We aim to bring you long-term focused analysis driven by fundamental data. Note that our analysis may not factor in the latest price-sensitive company announcements or qualitative material. Simply Wall St has no position in any stocks mentioned.
Have feedback on this article? Concerned about the content? Get in touch with us directly. Alternatively, email editorial-team@simplywallst.com