
 Nasdaq
 华尔街日报
华尔街日报Is Nvidia (NVDA) Still Priced Reasonably After Its 1 Year 57.8% Share Price Gain
- If you are wondering whether NVIDIA's current share price still makes sense, you are not alone. This article looks at what you are really paying for when you buy the stock.
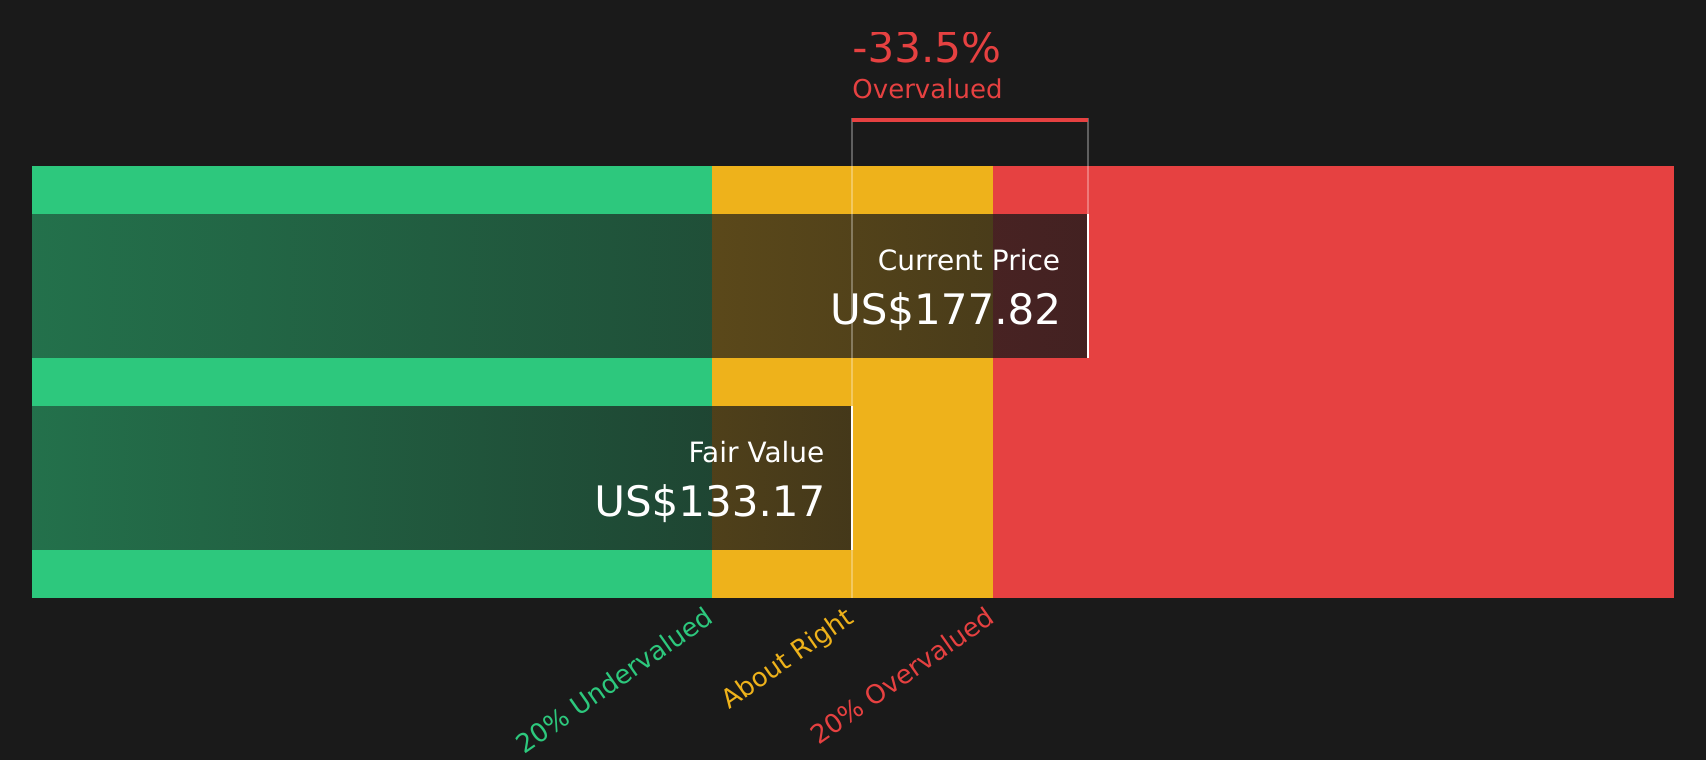
- NVIDIA shares last closed at US$177.82, with returns of 0.4% over 7 days, 3.5% over 30 days, a 5.8% decline year to date, and a 57.8% gain over 1 year, while the 3 year return is very large and over 7x over 5 years.
- Recent headlines have focused heavily on NVIDIA's role in graphics chips and data center hardware for high performance computing, alongside increased attention on its position in AI related workloads. This context has kept NVIDIA at the center of market conversations about semiconductor demand, capital investment and the long term importance of its technology stack.
- Our current valuation framework gives NVIDIA a valuation score of 3 out of 6. Next we will walk through what that means across different methods of valuing the company, before finishing with an even more complete way to think about its true worth.
Find out why NVIDIA's 57.8% return over the last year is lagging behind its peers.
Approach 1: NVIDIA Discounted Cash Flow (DCF) Analysis
Approach 1: NVIDIA Discounted Cash Flow (DCF) Analysis
A Discounted Cash Flow, or DCF, model projects a company’s future cash flows and then discounts them back to today’s value to estimate what the business might be worth per share right now.
For NVIDIA, the model used is a 2 Stage Free Cash Flow to Equity approach based on cash flow projections. The latest twelve month free cash flow is about $97.2b. Analyst and extrapolated estimates in the model point to projected free cash flow of $300.9b in 2031, with a detailed path of annual projections in between. All of these future cash flows are expressed in $ and are discounted back to today using Simply Wall St’s assumptions.
This process results in an estimated intrinsic value of around $133.17 per share, compared with the recent share price of $177.82. That gap implies the stock is about 33.5% overvalued according to this particular DCF setup.
Result: OVERVALUED
Our Discounted Cash Flow (DCF) analysis suggests NVIDIA may be overvalued by 33.5%. Discover 50 high quality undervalued stocks or create your own screener to find better value opportunities.
Approach 2: NVIDIA Price vs Earnings
For profitable companies, the P/E ratio is a useful way to think about what you are paying for each dollar of earnings. It links directly to the bottom line and gives you a quick sense of how the market is valuing those earnings compared with other options.
What counts as a “normal” or “fair” P/E usually reflects how the market sees a company’s growth outlook and risk. Higher growth and lower perceived risk tend to justify a higher multiple, while slower growth or higher uncertainty usually point to a lower one.
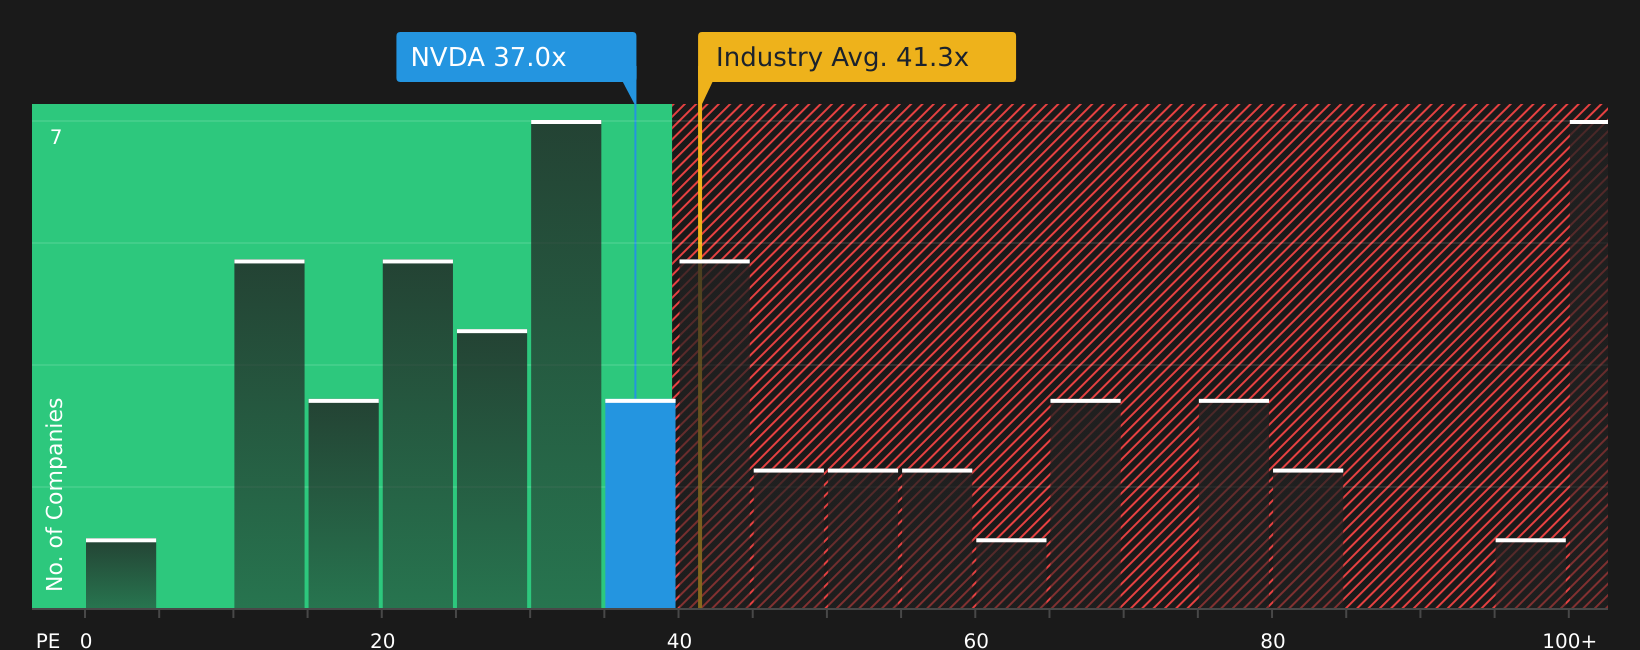
NVIDIA currently trades on a P/E of 35.98x. That sits below the peer group average of 80.70x and slightly below the broader Semiconductor industry average of 39.36x. Simply Wall St’s proprietary Fair Ratio for NVIDIA is 58.59x, which is the P/E level that its model suggests based on factors such as earnings growth, industry, profit margins, market cap and risk profile.
The Fair Ratio is more tailored than a simple peer or industry comparison because it adjusts for NVIDIA’s specific characteristics instead of assuming that all companies in the group should trade at the same multiple. Comparing the Fair Ratio of 58.59x with the actual P/E of 35.98x suggests the stock is undervalued on this metric.
Result: UNDERVALUED
P/E ratios tell one story, but what if the real opportunity lies elsewhere? Start investing in legacies, not executives. Discover our 20 top founder-led companies.
Upgrade Your Decision Making: Choose your NVIDIA Narrative
Earlier we mentioned that there is an even better way to understand valuation, so let us introduce you to Narratives, a simple way for you to attach a clear story about a company to concrete numbers like fair value estimates, future revenue, earnings and margins.
On Simply Wall St, a Narrative is your own take on what NVIDIA is and where it is heading. It is linked directly to a financial forecast and a fair value, so instead of just reacting to a P/E or DCF output, you are seeing how your story about data center demand, AI adoption or competition actually flows through to the numbers.
These Narratives live in the Community page on the platform, are used by millions of investors, and they are refreshed when new information arrives. If NVIDIA posts earnings, announces a new chip or faces fresh regulation, the underlying forecasts and fair values that sit behind each story are updated for you.
For NVIDIA today, you can already see how different investors translate their views into numbers, with community fair value estimates that range from around US$90 at the cautious end to about US$355 at the more optimistic end. Narratives make it easy to compare those fair values with the current share price so you can decide for yourself whether the gap between price and your own story suggests it is closer to a buying or a selling opportunity.
For NVIDIA, however, we will make it really easy for you with previews of two leading NVIDIA Narratives:
Fair value in this bullish AI infrastructure narrative: US$253.02 per share
Implied undervaluation versus the recent US$177.82 share price: about 29.7%
Revenue growth assumption: 30.90%
- Views NVIDIA as a key beneficiary of multi year AI infrastructure spending, with GPUs, networking and software tied to data center buildouts across cloud providers and sovereign projects.
- Assumes revenue, earnings and margins are supported by annual platform updates such as Blackwell and Rubin, plus a growing software and full stack ecosystem that increases customer reliance.
- Flags risks such as export controls on AI chips into China, custom silicon efforts at major customers, dependence on external foundries, and energy or regulatory limits on data center expansion.
Fair value in this more cautious narrative: US$141.74 per share
Implied overvaluation versus the recent US$177.82 share price: about 25.5%
Revenue growth assumption: 17.2%
- Sees NVIDIA as a leader in data center, gaming and automotive GPUs, but assumes more modest long term revenue growth and net margins of 40% as competition and pricing pressure increase.
- Highlights catalysts around AI data center demand, gaming, Omniverse and automotive, but treats some of these opportunities as slower to scale or less certain than the bull case.
- Emphasizes risks from rival GPUs and custom accelerators, consumer pricing sensitivities, supply chain disruptions and potential regulatory hurdles that could cap earnings and lead to compression in valuation multiples.
If you want to go beyond these snapshots and see the full narratives that underpin each view, including the detailed assumptions behind those fair values, you can start with the community range here and then build or adjust your own view using Curious how numbers become stories that shape markets? Explore Community Narratives.
Do you think there's more to the story for NVIDIA? Head over to our Community to see what others are saying!

This article by Simply Wall St is general in nature. We provide commentary based on historical data and analyst forecasts only using an unbiased methodology and our articles are not intended to be financial advice. It does not constitute a recommendation to buy or sell any stock, and does not take account of your objectives, or your financial situation. We aim to bring you long-term focused analysis driven by fundamental data. Note that our analysis may not factor in the latest price-sensitive company announcements or qualitative material. Simply Wall St has no position in any stocks mentioned.
Have feedback on this article? Concerned about the content? Get in touch with us directly. Alternatively, email editorial-team@simplywallst.com