
 Nasdaq
 华尔街日报
华尔街日报Does Albemarle (ALB) Price Reflect Its Recent 71% One Year Share Gain?
- If you are wondering whether Albemarle's current share price lines up with its underlying value, this article will walk you through what the numbers are actually saying.
- Albemarle recently closed at US$163.04, with returns of 1.1% over 7 days, 21.0% over 30 days, 13.3% year to date, 70.7% over 1 year, and longer term returns of negative 31.4% over 3 years and negative 0.4% over 5 years, providing a mixed picture for investors.
- Recent coverage around Albemarle has focused on how its share price performance compares with its longer term track record and how that context matters for investors thinking about valuation. This backdrop helps explain why some investors are reassessing what they are willing to pay for the stock today.
- On our checklist of six valuation tests, Albemarle scores 2 out of 6 on this valuation score. In this article we will look at what different valuation approaches say about the stock, then finish with a way to tie these methods together that can help you build your own view of value.
Albemarle scores just 2/6 on our valuation checks. See what other red flags we found in the full valuation breakdown.
Approach 1: Albemarle Discounted Cash Flow (DCF) Analysis
A Discounted Cash Flow model takes projected future cash flows and discounts them back to today, aiming to estimate what the entire stream of those cash flows is worth in present dollars.
For Albemarle, the latest twelve month free cash flow is a loss of about US$189.8 million, so the model puts most of the weight on future cash flow projections rather than recent history. Analysts have provided free cash flow estimates out to 2027, including US$305.8 million in 2026 and US$756.7 million in 2027. Beyond that, Simply Wall St extrapolates up to ten years, with projected free cash flow in 2035 of about US$3.9 billion.
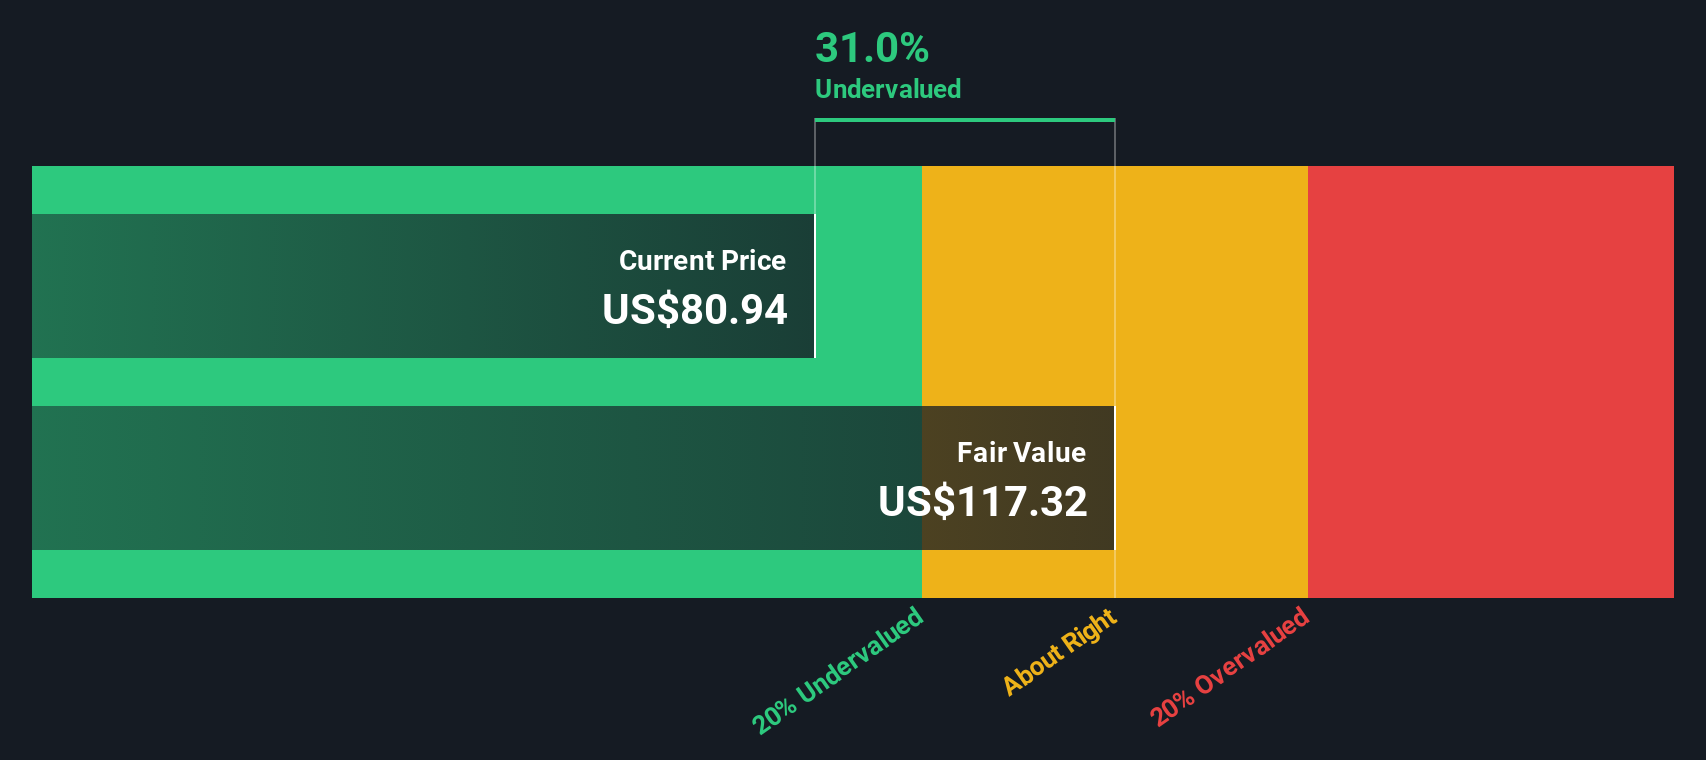
Using a 2 Stage Free Cash Flow to Equity model, these projected cash flows are discounted back to today to give an estimated intrinsic value of around US$481.79 per share. Compared with the recent share price of US$163.04, this DCF output implies Albemarle trades at about a 66.2% discount to that intrinsic estimate. On this model alone, the shares appear to be materially undervalued.
Result: UNDERVALUED
Our Discounted Cash Flow (DCF) analysis suggests Albemarle is undervalued by 66.2%. Track this in your watchlist or portfolio, or discover 871 more undervalued stocks based on cash flows.
Approach 2: Albemarle Price vs Sales
For companies where earnings can be volatile, the P/S ratio is often a useful way to think about value because it focuses on revenue rather than profit, which can swing around more from year to year.
What investors are really weighing with any valuation multiple is how much they are willing to pay today for each unit of the company’s results, given their expectations for growth and the risks they see. Higher expected growth and lower perceived risk usually justify a higher normal multiple, while slower growth or higher risk usually justify a lower one.
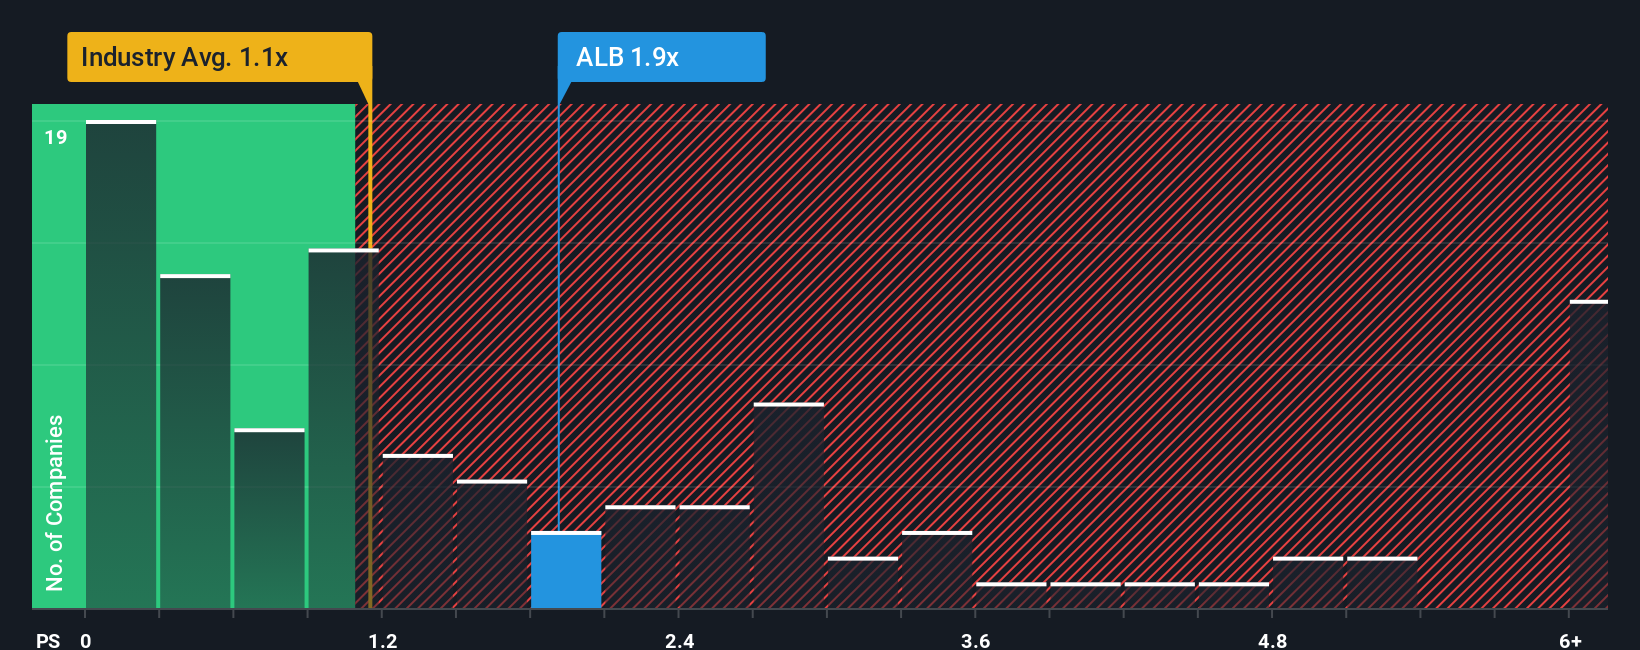
Albemarle currently trades on a P/S ratio of 3.88x. That sits above the Chemicals industry average of 1.18x and also above the peer group average of 2.44x, so on simple comparisons the shares look more expensive than many rivals. Simply Wall St’s Fair Ratio for Albemarle is 1.32x, which is a proprietary estimate of what the P/S might be based on factors such as earnings growth, profit margins, industry, market cap and specific risks.
Because the Fair Ratio folds all of those company specific inputs into a single number, it can provide a more tailored benchmark than a broad industry or peer average. With Albemarle’s actual P/S of 3.88x versus a Fair Ratio of 1.32x, the shares screen as overvalued on this measure.
Result: OVERVALUED
P/S ratios tell one story, but what if the real opportunity lies elsewhere? Discover 1442 companies where insiders are betting big on explosive growth.
Upgrade Your Decision Making: Choose your Albemarle Narrative
Earlier we mentioned that there is an even better way to understand valuation. On Simply Wall St’s Community page you can use Narratives, where you set out your story for Albemarle, link that story to specific assumptions for future revenue, earnings and margins, and see how those inputs roll into a fair value that you can compare with the current share price. This can help you decide whether to buy, hold or sell, with the Narrative then updating automatically as new information such as earnings or lithium market news is added. One investor might build a bullish Albemarle Narrative that leans on the higher US$200 price target and assumes stronger earnings power and higher acceptable future P/E, while another might anchor to the lower US$58 target with more cautious margin and pricing assumptions. Both can clearly see how their different views translate into different fair values and decisions.
Do you think there's more to the story for Albemarle? Head over to our Community to see what others are saying!

This article by Simply Wall St is general in nature. We provide commentary based on historical data and analyst forecasts only using an unbiased methodology and our articles are not intended to be financial advice. It does not constitute a recommendation to buy or sell any stock, and does not take account of your objectives, or your financial situation. We aim to bring you long-term focused analysis driven by fundamental data. Note that our analysis may not factor in the latest price-sensitive company announcements or qualitative material. Simply Wall St has no position in any stocks mentioned.
Have feedback on this article? Concerned about the content? Get in touch with us directly. Alternatively, email editorial-team@simplywallst.com