
 Nasdaq
 华尔街日报
华尔街日报Is It Too Late To Consider Moody's (MCO) After Strong Multi‑Year Share Price Gains?
- If you are wondering whether Moody's current share price lines up with its underlying value, you are not alone. Many investors are asking the same question right now.
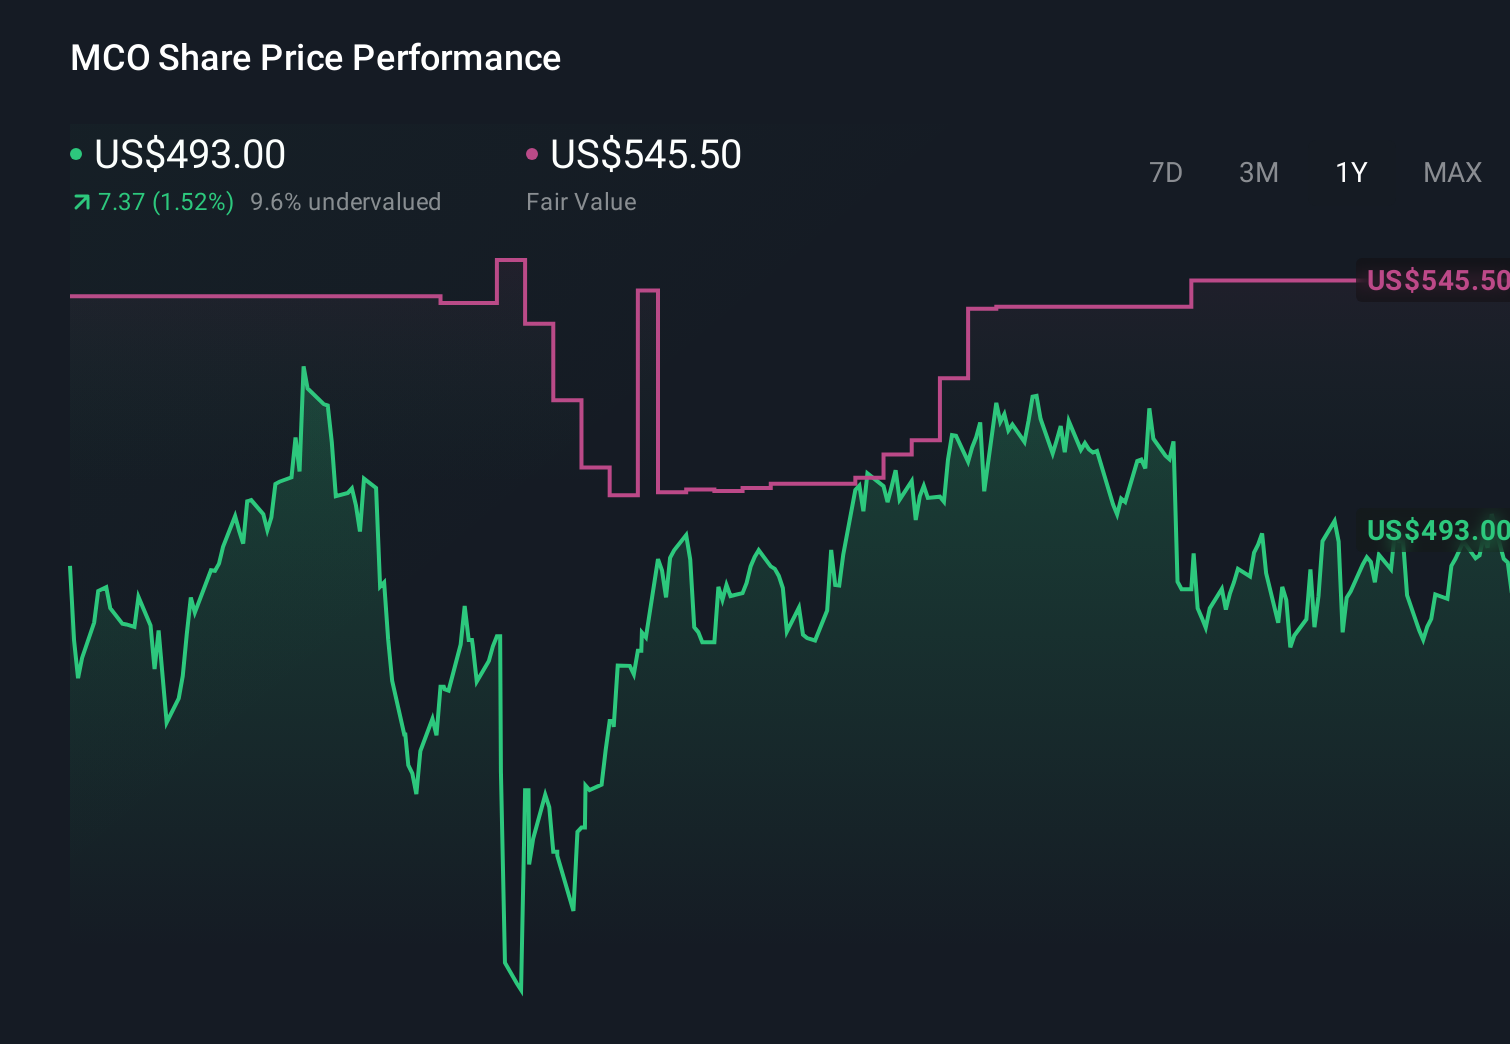
- The stock last closed at US$538.92, with stated returns of 1.4% over 7 days, 8.0% over 30 days and year to date, 14.1% over 1 year, 72.4% over 3 years and 110.7% over 5 years.
- Recent coverage has focused on how Moody's position as a major credit rating and analytics provider feeds into market sentiment on credit conditions and capital markets activity. These kinds of headlines help frame why investors are closely watching the share price and reassessing what they are willing to pay for the business.
- Despite that backdrop, Moody's currently has a valuation score of 0 out of 6. We will look at several common valuation approaches next, then finish with a broader way to think about what the stock might be worth.
Moody's scores just 0/6 on our valuation checks. See what other red flags we found in the full valuation breakdown.
Approach 1: Moody's Excess Returns Analysis
The Excess Returns model starts with a simple idea: if a company earns more on its equity than investors require, that extra return can justify a higher valuation. For Moody's, this framework looks at how efficiently it is expected to use shareholders' capital over time.
Analysts currently estimate stable earnings of $18.66 per share, based on weighted future Return on Equity inputs from 6 analysts. Against a book value of $22.18 per share, this implies an average Return on Equity of 61.81%, which is above the estimated cost of equity of $2.50 per share. The gap between those two figures is the excess return, calculated here at $16.17 per share.
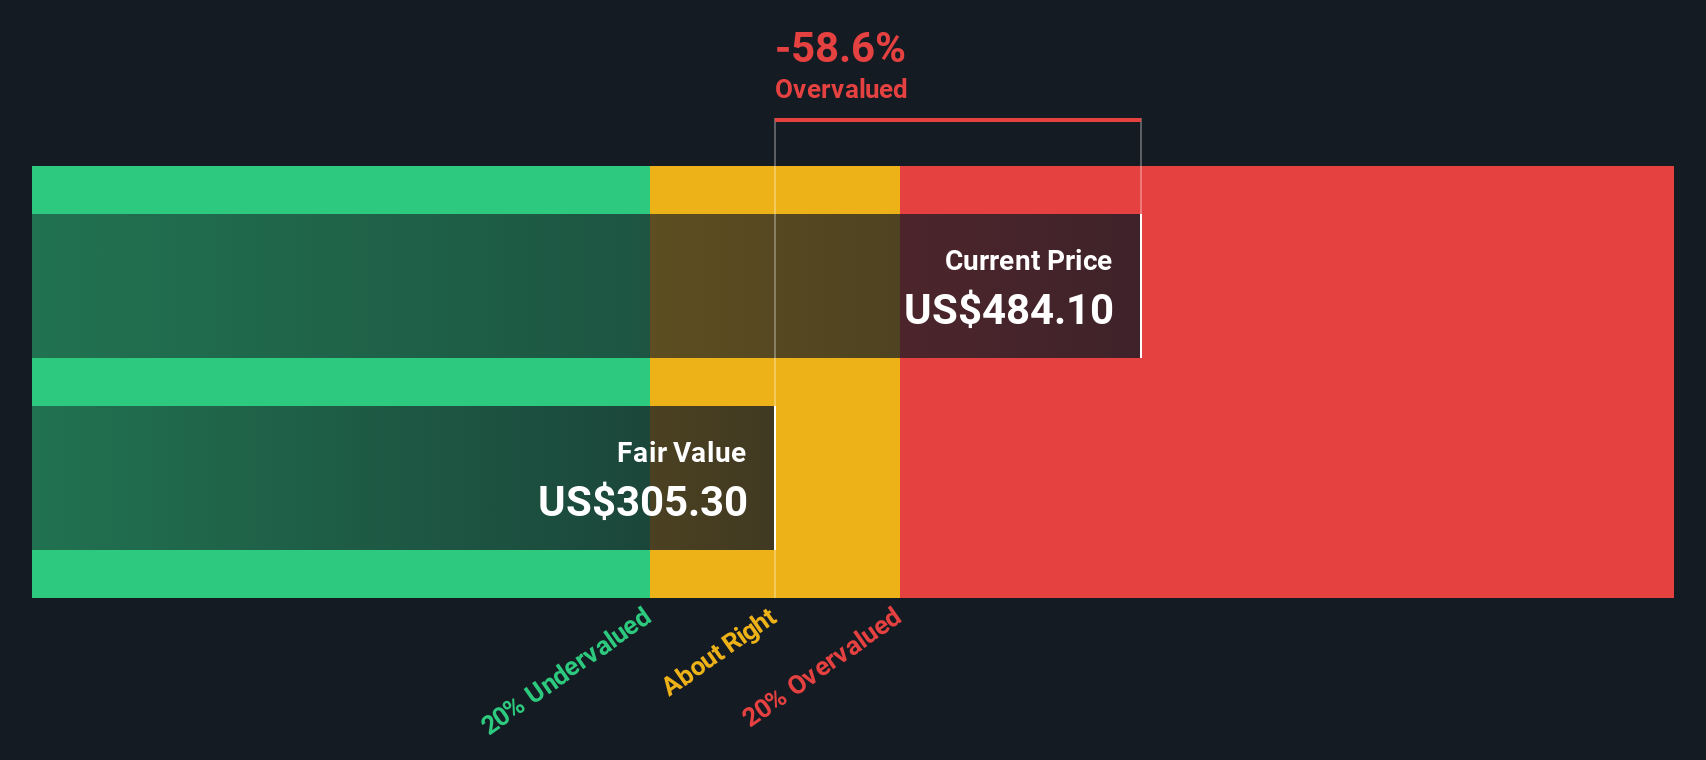
The model also assumes Moody's book value settles at a stable level of $30.19 per share, using estimates from 5 analysts. Combining these inputs, the Excess Returns model arrives at an intrinsic value of about $353.32 per share. Compared with the recent share price of $538.92, this framework suggests Moody's is trading at a substantially higher level than this model's estimate of intrinsic value.
Result: OVERVALUED
Our Excess Returns analysis suggests Moody's may be overvalued by 52.5%. Discover 871 undervalued stocks or create your own screener to find better value opportunities.
Approach 2: Moody's Price vs Earnings
For a profitable business like Moody's, the P/E ratio is a straightforward way to think about what you are paying for each dollar of earnings. It ties the share price directly to current earnings, which is often where many investors start when assessing valuation.
A higher or lower P/E is not good or bad on its own; it reflects what the market is implying about future growth and risk. Higher expected growth or lower perceived risk can support a higher P/E, while lower growth or higher risk usually point to a lower, more conservative multiple.
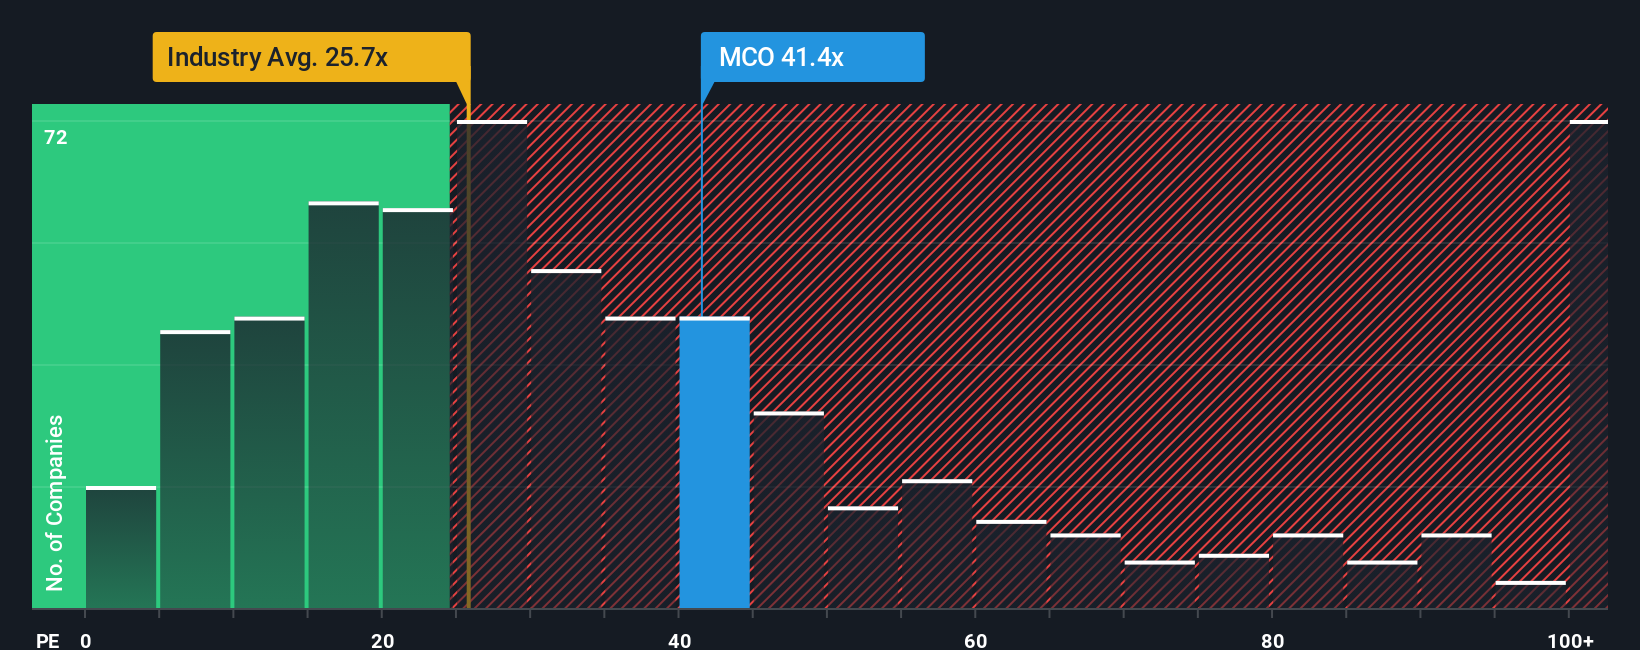
Moody's currently trades on a P/E of 42.84x, compared with the Capital Markets industry average of 25.78x and a peer average of 33.30x. Simply Wall St's Fair Ratio for Moody's is 18.30x. This Fair Ratio is a proprietary estimate of what a reasonable P/E could look like given the company’s earnings growth profile, profit margins, size, risk factors and its industry, rather than just a simple comparison with peers.
Because the Fair Ratio of 18.30x is well below the current P/E of 42.84x, this approach points to Moody's trading at a richer level than what the Fair Ratio suggests.
Result: OVERVALUED
P/E ratios tell one story, but what if the real opportunity lies elsewhere? Discover 1442 companies where insiders are betting big on explosive growth.
Upgrade Your Decision Making: Choose your Moody's Narrative
Earlier we mentioned that there is an even better way to understand valuation, so Narratives on Simply Wall St let you write your own story for Moody's by linking your view of its business, your forecasts for revenue, earnings and margins, and your fair value estimate. The platform then automatically compares that fair value to the current price and updates it as new news or earnings arrive. One investor might build a Narrative that leans closer to the higher analyst price target of about US$620, while another might anchor around the lower end near US$470. You can see both perspectives side by side on the Community page and decide which story you find more convincing.
Do you think there's more to the story for Moody's? Head over to our Community to see what others are saying!
This article by Simply Wall St is general in nature. We provide commentary based on historical data and analyst forecasts only using an unbiased methodology and our articles are not intended to be financial advice. It does not constitute a recommendation to buy or sell any stock, and does not take account of your objectives, or your financial situation. We aim to bring you long-term focused analysis driven by fundamental data. Note that our analysis may not factor in the latest price-sensitive company announcements or qualitative material. Simply Wall St has no position in any stocks mentioned.
Have feedback on this article? Concerned about the content? Get in touch with us directly. Alternatively, email editorial-team@simplywallst.com