
 Nasdaq
 华尔街日报
华尔街日报A Look At Shanghai Henlius Biotech (SEHK:2696) Valuation After FDA Acceptance Of HANBEITAI Application
Shanghai Henlius Biotech (SEHK:2696) is back in focus after the US FDA accepted its biologics license application for HANBEITAI, covering multiple oncology indications across colorectal, lung, brain, kidney, ovarian and cervical cancers.
See our latest analysis for Shanghai Henlius Biotech.
The HANBEITAI filing comes after a period of strong market interest, with a 30 day share price return of 12.72%, year to date share price return of 16.47%, and a very large 1 year total shareholder return. This suggests momentum has picked up despite a softer 90 day share price return of 4.75%.
If this kind of regulatory progress has your attention, it could be a good moment to look across other healthcare stocks that are shaping the future of treatment.
With Shanghai Henlius Biotech trading at HK$68.25 and various estimates suggesting a sizeable intrinsic and target price gap, the real question is whether this reflects an undervalued growth story or a market that is already pricing in future gains.
Price to Earnings of 40.2x: Is it justified?
On a P/E of 40.2x at a last close of HK$68.25, Shanghai Henlius Biotech screens as expensive relative to both the Asian biotech industry average and its own estimated fair ratio, even though it compares more favourably against a narrower peer set.
The P/E ratio compares the current share price with earnings per share and is a quick way to see how much investors are paying for each unit of profit. For a biotech group with positive earnings and a commercial product portfolio, a higher P/E can reflect expectations for ongoing earnings growth and product monetisation.
Here, Shanghai Henlius Biotech trades on a 40.2x P/E, which is above the estimated fair P/E of 20x that our models suggest the market could move towards, and slightly above the 39.3x Asian biotech industry average. At the same time, it sits well below the 74.9x peer average, which indicates investors are paying less per unit of earnings than for some comparable names, based on the recent earnings growth cited in the data.
Explore the SWS fair ratio for Shanghai Henlius Biotech
Result: Price-to-earnings of 40.2x (OVERVALUED)
However, a 40.2x P/E can quickly look stretched if profit growth stalls, or if key pipeline assets like HANBEITAI or HANSIZHUANG face regulatory or competitive setbacks.
Find out about the key risks to this Shanghai Henlius Biotech narrative.
Another View: DCF Points In The Opposite Direction
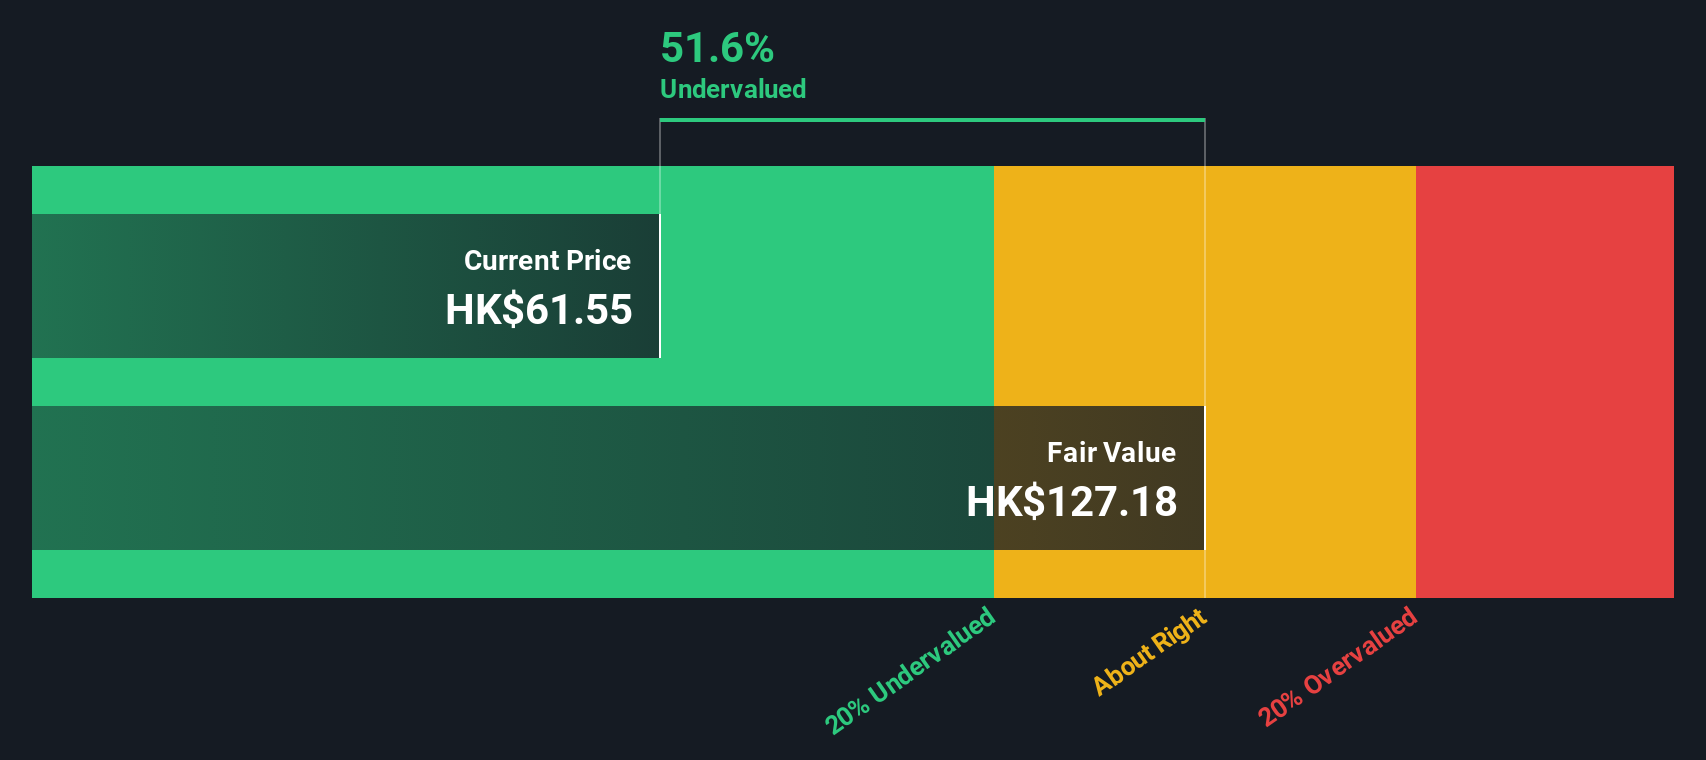
While the 40.2x P/E flags Shanghai Henlius Biotech as expensive relative to its fair ratio and the Asian biotech average, our DCF model points the other way, with the shares trading about 61.6% below an estimated fair value of HK$177.66. That kind of gap can look like a margin of safety or a sign that the market is questioning the forecasts.
Look into how the SWS DCF model arrives at its fair value.
Simply Wall St performs a discounted cash flow (DCF) on every stock in the world every day (check out Shanghai Henlius Biotech for example). We show the entire calculation in full. You can track the result in your watchlist or portfolio and be alerted when this changes, or use our stock screener to discover 871 undervalued stocks based on their cash flows. If you save a screener we even alert you when new companies match - so you never miss a potential opportunity.
Build Your Own Shanghai Henlius Biotech Narrative
If you see the numbers differently, or simply want to test your own assumptions against the data, you can build a personalised thesis in just a few minutes with Do it your way.
A great starting point for your Shanghai Henlius Biotech research is our analysis highlighting 3 key rewards and 1 important warning sign that could impact your investment decision.
Looking for more investment ideas?
If you only stop at one stock, you could miss opportunities that fit your style even better, so give yourself options and see what else stands out.
- Hunt for potential high impact small caps by scanning these 3528 penny stocks with strong financials that already show stronger financial foundations than many would expect at this size.
- Tap into growth themes by checking these 24 AI penny stocks that are tied to real business models rather than just headlines about artificial intelligence.
- Focus on value by reviewing these 871 undervalued stocks based on cash flows that current market prices do not fully reflect based on their cash flow profiles.
This article by Simply Wall St is general in nature. We provide commentary based on historical data and analyst forecasts only using an unbiased methodology and our articles are not intended to be financial advice. It does not constitute a recommendation to buy or sell any stock, and does not take account of your objectives, or your financial situation. We aim to bring you long-term focused analysis driven by fundamental data. Note that our analysis may not factor in the latest price-sensitive company announcements or qualitative material. Simply Wall St has no position in any stocks mentioned.
Have feedback on this article? Concerned about the content? Get in touch with us directly. Alternatively, email editorial-team@simplywallst.com