
 Nasdaq
 华尔街日报
华尔街日报Is It Too Late To Consider Corning (GLW) After Its 1-Year 92% Share Price Surge?
- If you are wondering whether Corning is priced attractively after its recent run, this article will walk through what the current share price could imply about its value.
- At a last close of US$94.20, Corning's shareholders have seen returns of 10.5% over 7 days, 10.3% over 30 days, 3.9% year to date, 92.6% over 1 year, 185.6% over 3 years and 187.5% over 5 years.
- Recent attention on Corning has centered on ongoing developments in its core glass and materials businesses and how these feed into expectations for its future role across consumer electronics and communications. These themes have formed the backdrop to the strong share price performance and are a key part of how investors are framing the current level.
- Simply Wall St currently assigns Corning a valuation score of 0 out of 6. In this article we will look at how traditional methods like DCFs and multiples interpret that score, and then finish with a way of thinking about valuation that can give you an even clearer view of the company.
Corning scores just 0/6 on our valuation checks. See what other red flags we found in the full valuation breakdown.
Approach 1: Corning Discounted Cash Flow (DCF) Analysis
A Discounted Cash Flow model takes estimates of a company’s future cash flows and discounts them back to today using a required return, giving an estimate of what the whole business might be worth in dollars at present.
For Corning, the model used is a 2 Stage Free Cash Flow to Equity approach, starting from last twelve months free cash flow of about US$938.1 million. Analysts have provided specific free cash flow estimates out to 2029, for example US$2.1b in 2026 and US$3.4b in 2029, and Simply Wall St extrapolates further years to build a 10 year path of projected cash flows.
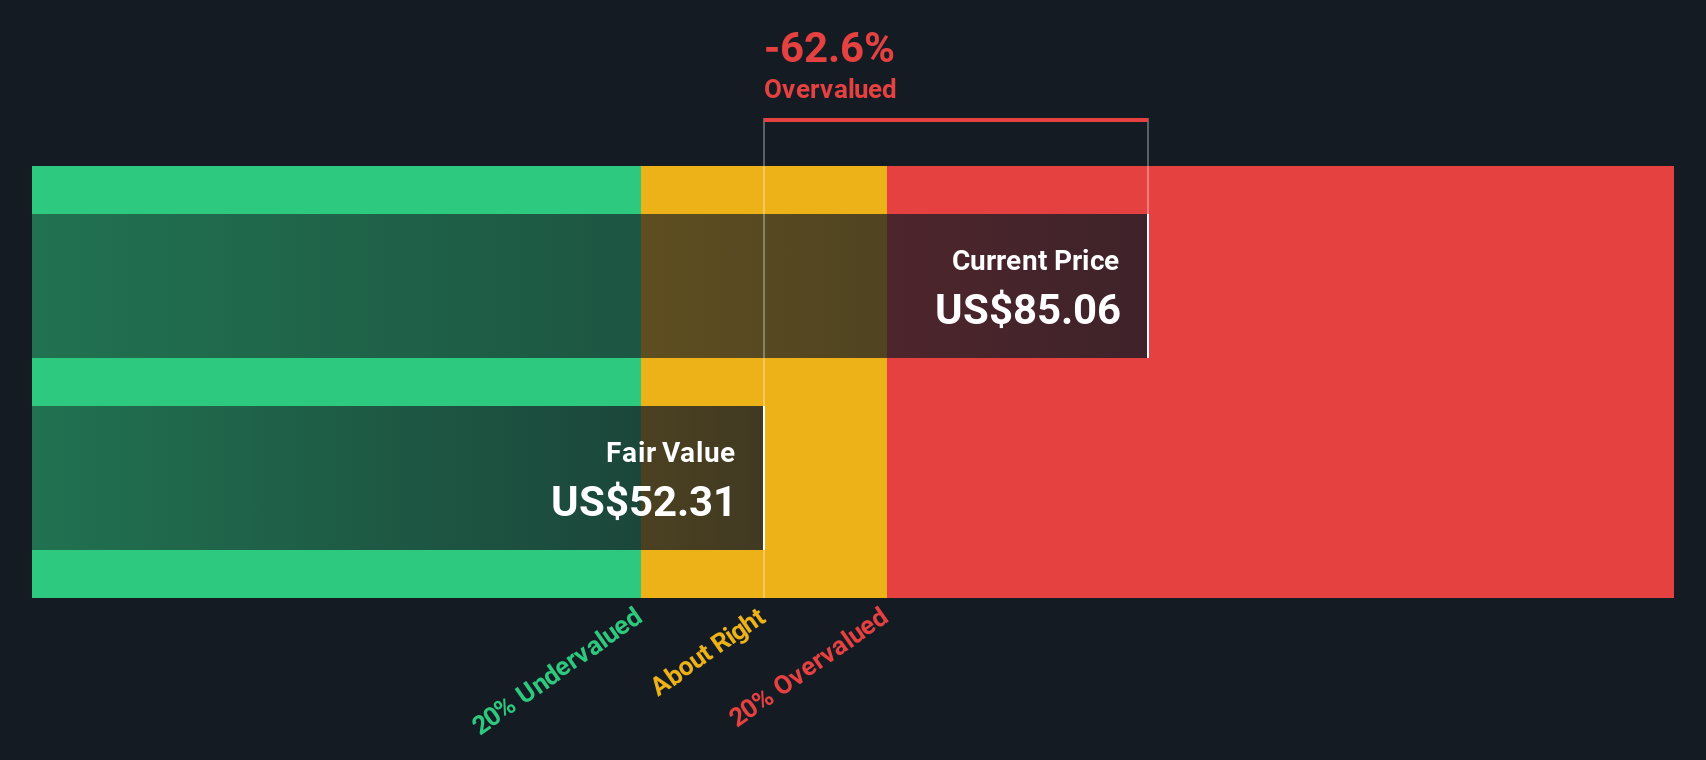
Those projected cash flows, such as US$4.3b in 2035, are discounted back to today and summed to arrive at an estimated intrinsic value per share of US$65.95. Compared with the recent share price of US$94.20, the model implies Corning is around 42.8% above this DCF-based estimate.
Result: OVERVALUED
Our Discounted Cash Flow (DCF) analysis suggests Corning may be overvalued by 42.8%. Discover 871 undervalued stocks or create your own screener to find better value opportunities.
Approach 2: Corning Price vs Earnings
For profitable companies like Corning, the P/E ratio is a common way to think about valuation because it links what you pay for each share with the earnings that the business is currently generating.
What counts as a “normal” P/E depends on how quickly earnings are expected to grow and how risky those earnings are. Higher growth or lower perceived risk can support a higher P/E, while slower growth or higher uncertainty usually points to a lower multiple.
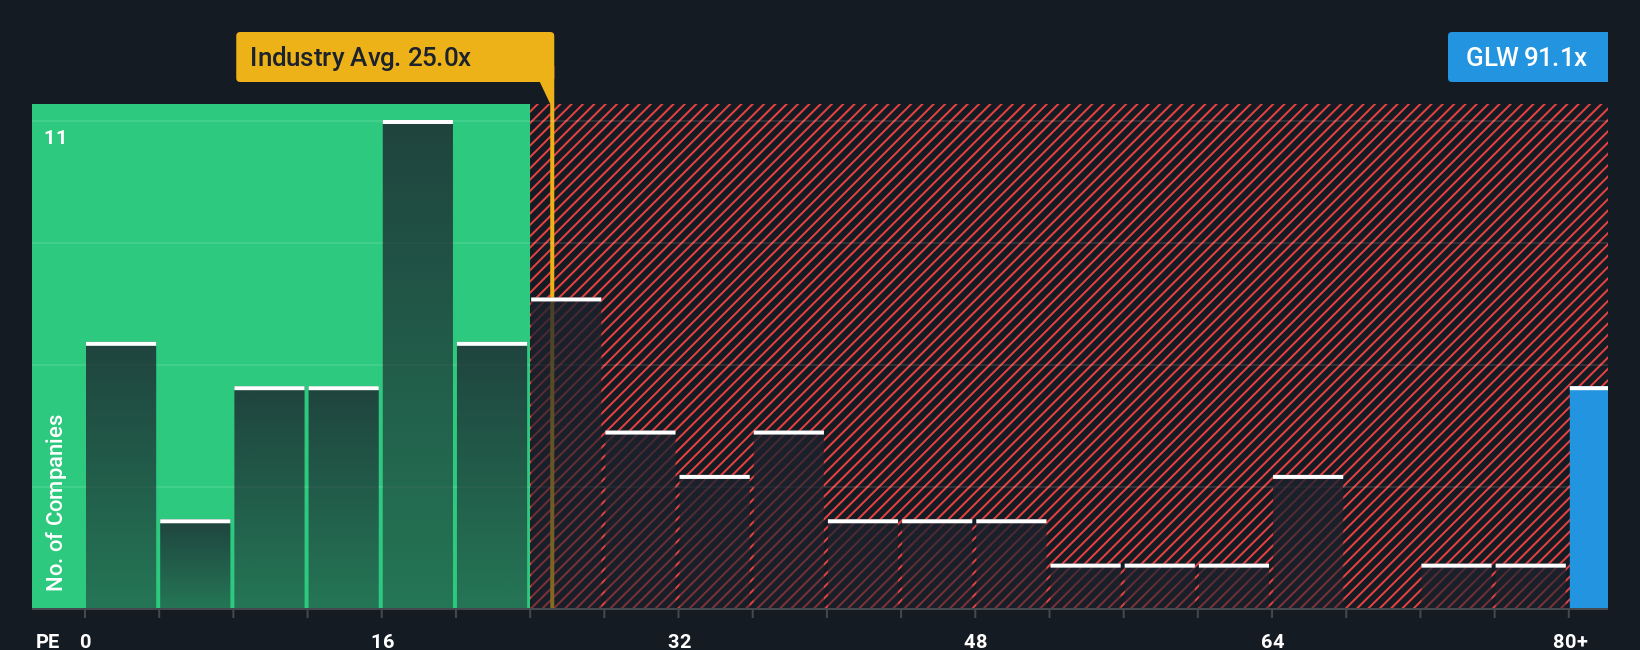
Corning currently trades on a P/E of 59.12x, compared with an industry average of 27.84x for Electronic companies and a peer average of 41.84x. Simply Wall St also calculates a proprietary “Fair Ratio” of 36.01x. This Fair Ratio is designed to be more tailored than simple peer or industry comparisons because it factors in elements like earnings growth, profit margins, company size, industry and key risks.
When you line up Corning’s current P/E of 59.12x against the Fair Ratio of 36.01x, the shares screen as trading above the level that model would suggest.
Result: OVERVALUED
P/E ratios tell one story, but what if the real opportunity lies elsewhere? Discover 1442 companies where insiders are betting big on explosive growth.
Upgrade Your Decision Making: Choose your Corning Narrative
Earlier we mentioned that there is an even better way to understand valuation. On Simply Wall St's Community page you can use Narratives, where you tell the story you believe about Corning, link that story to assumptions for future revenue, earnings and margins, translate those into a fair value, and then compare that fair value with the current share price. The platform updates your view automatically when new news or earnings arrive. This is why one investor might create a bullish Corning Narrative built around strong optical and solar demand, higher profit margins of 14.80%, revenue growth of 14.12% and a fair value close to US$93.31, while another might focus on tariff exposure, competition and the lowest analyst price target of US$47.00. That could lead to a much more cautious fair value and a very different decision about whether the current price looks attractive or not.
Do you think there's more to the story for Corning? Head over to our Community to see what others are saying!

This article by Simply Wall St is general in nature. We provide commentary based on historical data and analyst forecasts only using an unbiased methodology and our articles are not intended to be financial advice. It does not constitute a recommendation to buy or sell any stock, and does not take account of your objectives, or your financial situation. We aim to bring you long-term focused analysis driven by fundamental data. Note that our analysis may not factor in the latest price-sensitive company announcements or qualitative material. Simply Wall St has no position in any stocks mentioned.
Have feedback on this article? Concerned about the content? Get in touch with us directly. Alternatively, email editorial-team@simplywallst.com