
 Nasdaq
 华尔街日报
华尔街日报Is It Too Late To Consider CNO Financial Group (CNO) After Its Strong Multi‑Year Run
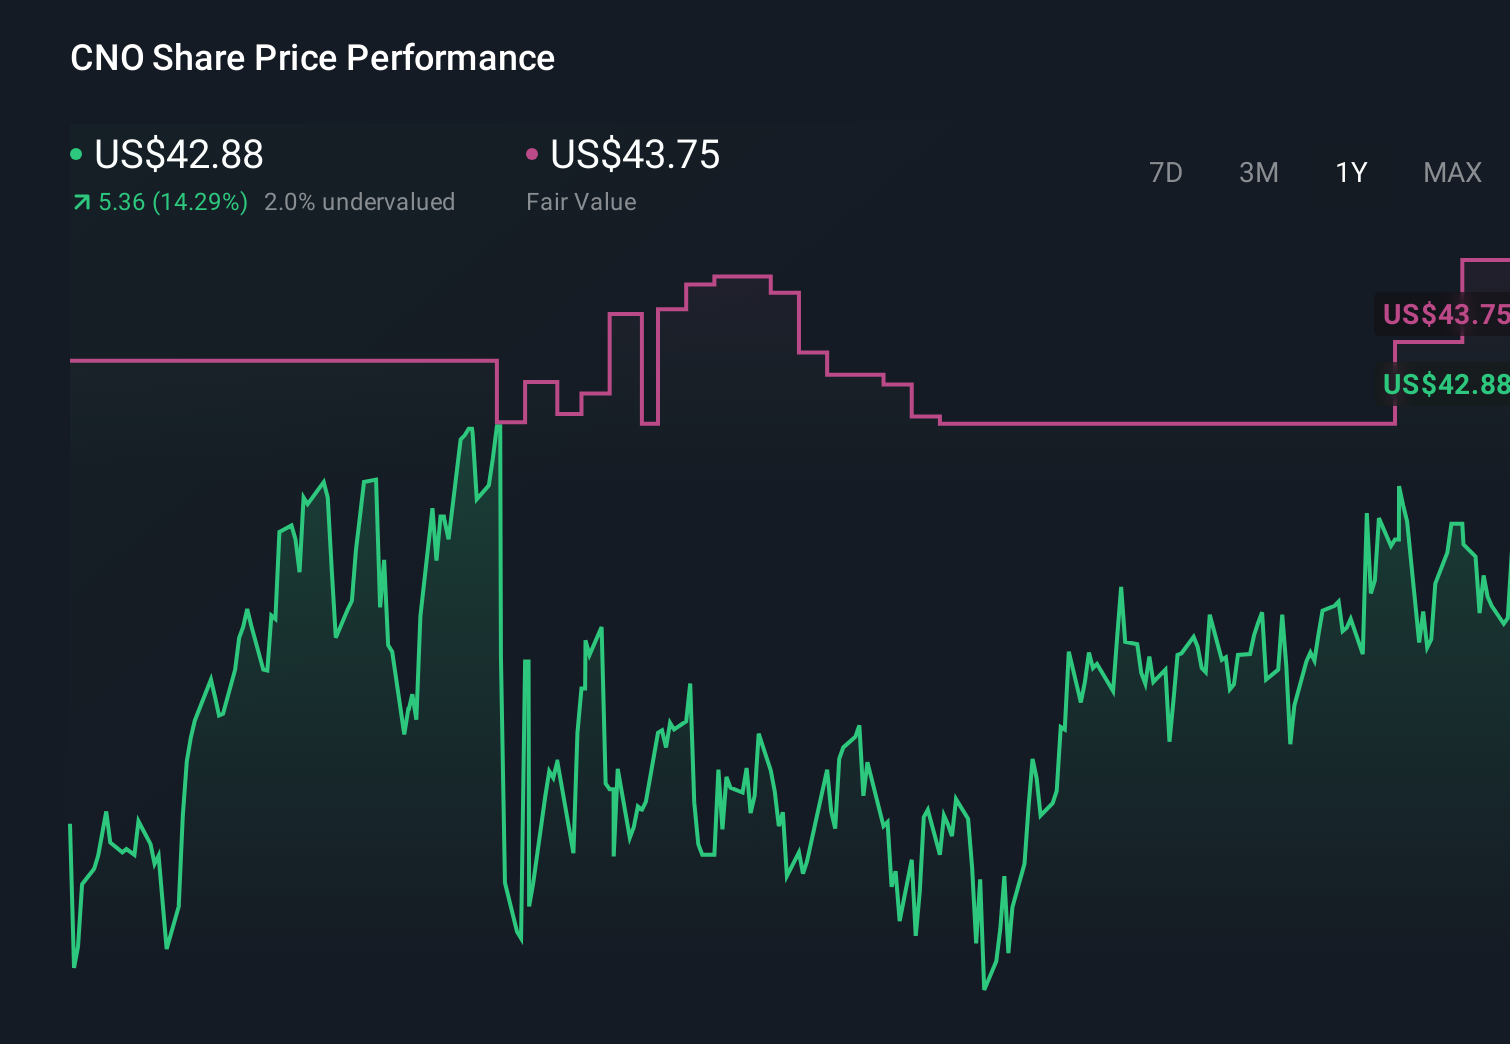
- Wondering if CNO Financial Group at around US$43.91 is still offering value after its strong run, or if most of the opportunity has already been priced in.
- The stock has returned 3.4% over the last 7 days, 9.7% over the last 30 days, 4.1% year to date, 20.3% over 1 year and more than doubled over 3 and 5 year periods.
- These moves sit against ongoing interest in insurers that some investors see as potential income and stability anchors, as well as periodic shifts in sentiment around financials. Recent coverage has focused on how insurers like CNO balance growth, capital returns and risk management, which can all influence how the market prices the shares.
- CNO currently has a valuation score of 3/6. This suggests the stock screens as undervalued on half of the checks reviewed next. A more rounded way to think about valuation will also be considered by the end of the article.
Approach 1: CNO Financial Group Excess Returns Analysis
The Excess Returns model looks at how efficiently a company uses shareholders’ equity, comparing the return it earns to the return investors require. The value of the stock comes from the stream of returns above that required cost of equity, capitalized into an intrinsic value per share.
For CNO Financial Group, book value is $27.24 per share and the model uses a stable earnings figure of $4.30 per share, based on the median return on equity over the past 5 years. The implied cost of equity is $2.53 per share, so the excess return is $1.77 per share. The average return on equity used in the model is 13.23%. A stable book value of $32.52 per share is assumed, drawn from weighted future book value estimates from 3 analysts.
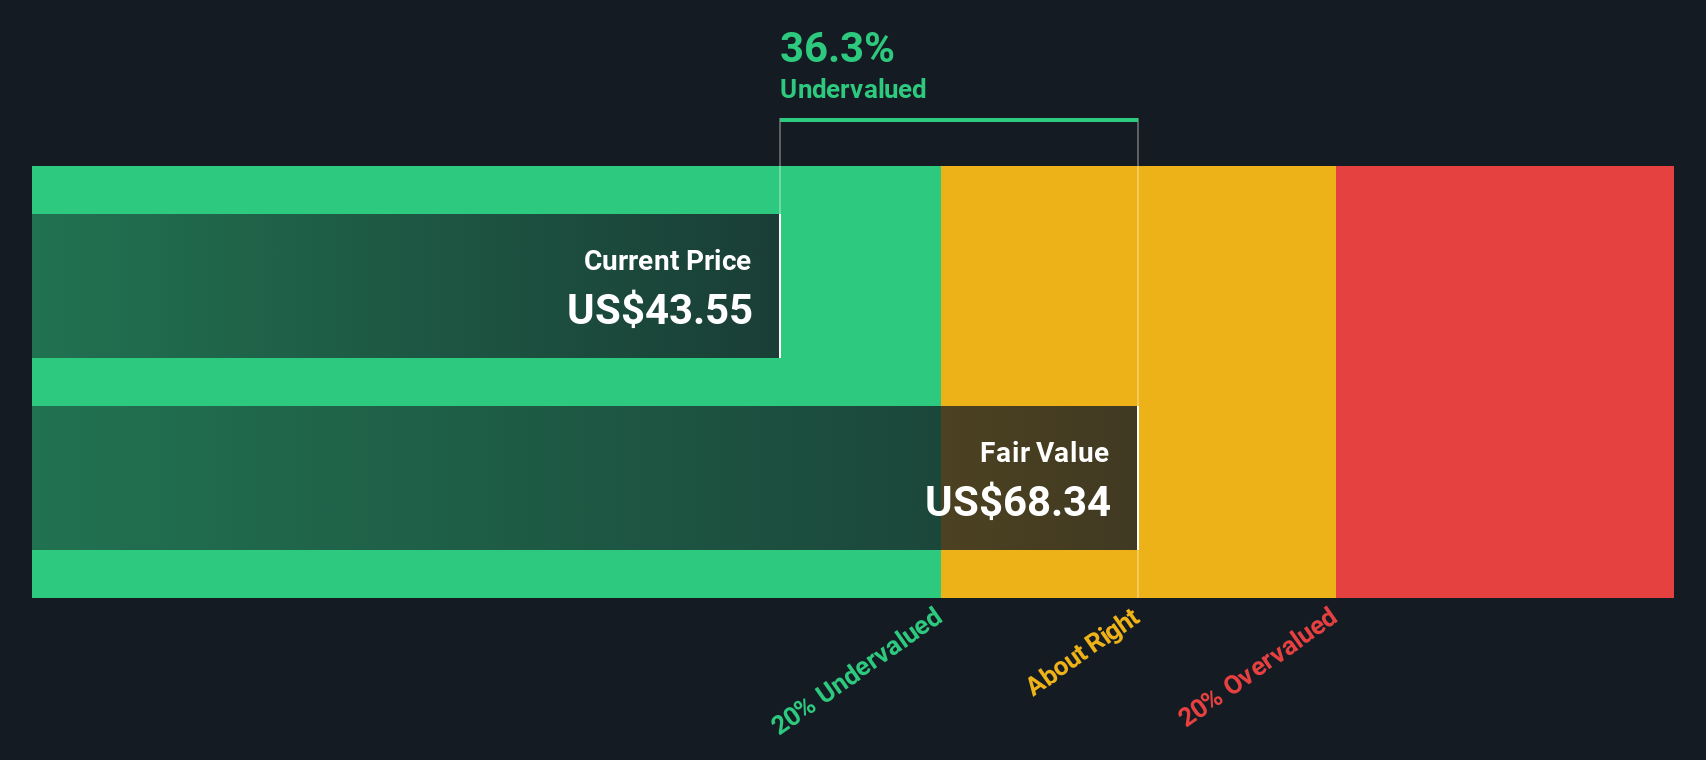
Using these inputs, the Excess Returns model arrives at an intrinsic value estimate of about $71.55 per share. Against a current price around $43.91, this indicates an implied discount of 38.6%, and on this approach the shares appear to screen as undervalued.
Result: UNDERVALUED
Our Excess Returns analysis suggests CNO Financial Group is undervalued by 38.6%. Track this in your watchlist or portfolio, or discover 881 more undervalued stocks based on cash flows.
Approach 2: CNO Financial Group Price vs Earnings
For a profitable company like CNO Financial Group, the price to earnings, or P/E, ratio is a useful yardstick because it links what you pay for the stock to the earnings the business is currently generating. Investors usually accept a higher P/E if they expect stronger growth or see lower risk, while slower growth or higher perceived risk typically supports a lower, more cautious range.
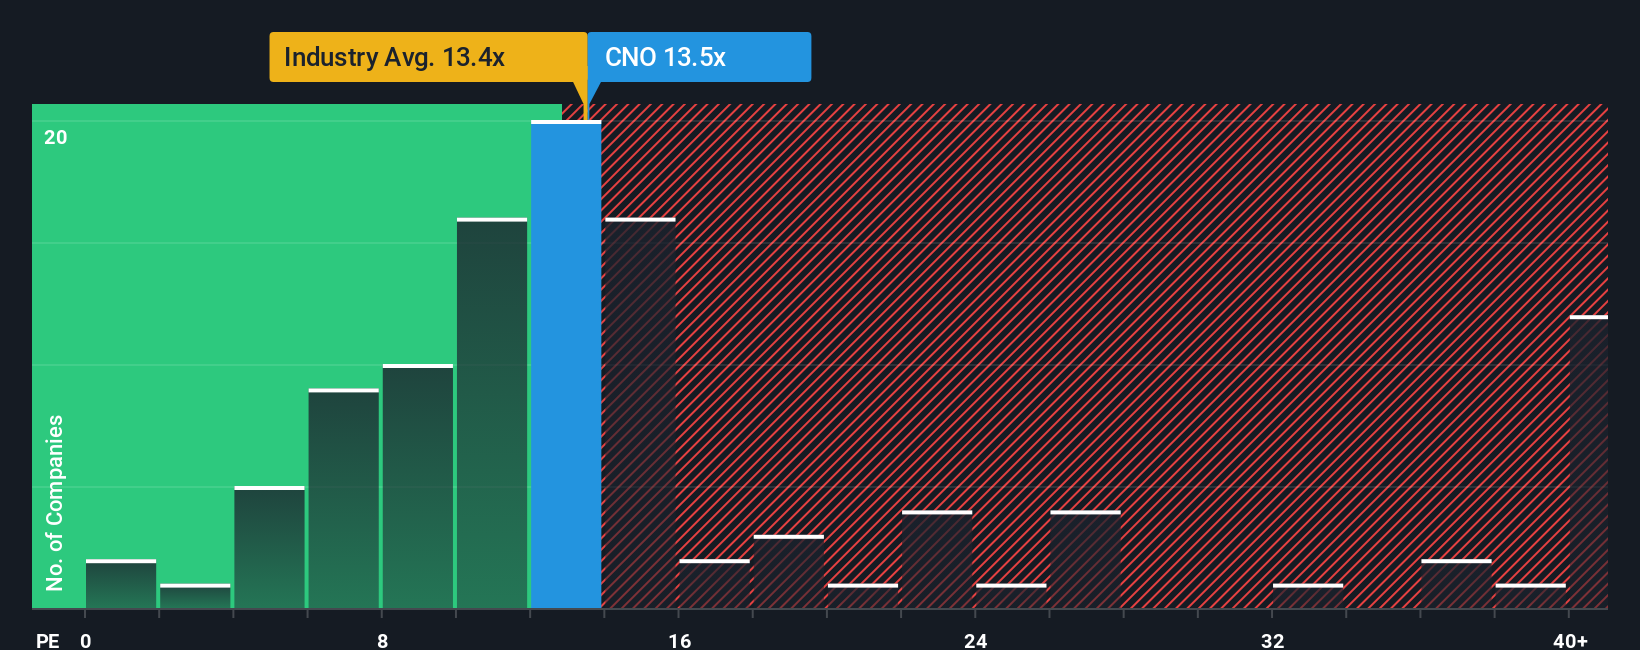
CNO’s current P/E is 13.84x. That sits above the Insurance industry average of 12.93x and above the peer group average of 9.82x, so on simple comparisons the shares trade at a higher earnings multiple than many listed insurers.
Simply Wall St’s Fair Ratio for CNO is 16.25x. This is its proprietary estimate of what a “normal” P/E could look like after considering factors such as earnings growth, profit margins, industry, market cap and company specific risks. This Fair Ratio can be more informative than just lining up CNO against peers or the industry, because it adjusts for those differences rather than assuming all insurers deserve the same multiple. With the current P/E of 13.84x sitting below the Fair Ratio of 16.25x, CNO screens as undervalued on this approach.
Result: UNDERVALUED
P/E ratios tell one story, but what if the real opportunity lies elsewhere? Discover 1445 companies where insiders are betting big on explosive growth.
Upgrade Your Decision Making: Choose your CNO Financial Group Narrative
Earlier we mentioned that there is an even better way to understand valuation. Let us introduce you to Narratives, which are simply your story about CNO Financial Group linked to your own expectations for its future revenue, earnings, margins and fair value, and then compared with the current share price to help you judge whether it looks attractive or not.
Do you think there's more to the story for CNO Financial Group? Head over to our Community to see what others are saying!
This article by Simply Wall St is general in nature. We provide commentary based on historical data and analyst forecasts only using an unbiased methodology and our articles are not intended to be financial advice. It does not constitute a recommendation to buy or sell any stock, and does not take account of your objectives, or your financial situation. We aim to bring you long-term focused analysis driven by fundamental data. Note that our analysis may not factor in the latest price-sensitive company announcements or qualitative material. Simply Wall St has no position in any stocks mentioned.
Have feedback on this article? Concerned about the content? Get in touch with us directly. Alternatively, email editorial-team@simplywallst.com