
 Nasdaq
 华尔街日报
华尔街日报Is Merck (MRK) Pricing Reflecting Its DCF And P/E Signals After Recent Share Gains
- If you are wondering whether Merck is fairly priced or offering value right now, it helps to step back and look at what the recent share performance and fundamentals are actually telling you.
- Merck's share price last closed at US$108.60, with returns of 3.2% over the past 7 days, 9.8% over 30 days, 2.0% year to date, 12.9% over 1 year and 62.1% over 5 years. This gives you a sense of how the market has been treating the stock across different time frames.
- Recent attention on Merck has been shaped by ongoing developments around its drug pipeline, regulatory decisions and competitive positioning in key therapeutic areas. These kinds of updates can influence how investors weigh the durability of future cash flows against current pricing, which helps explain why the share price has drawn interest lately.
- On our valuation checks, Merck scores 5 out of 6 for potential undervaluation, giving it a valuation score of 5. Next we will look at how different valuation methods line up, before finishing with an even broader way of thinking about what this score really means for you.
Find out why Merck's 12.9% return over the last year is lagging behind its peers.
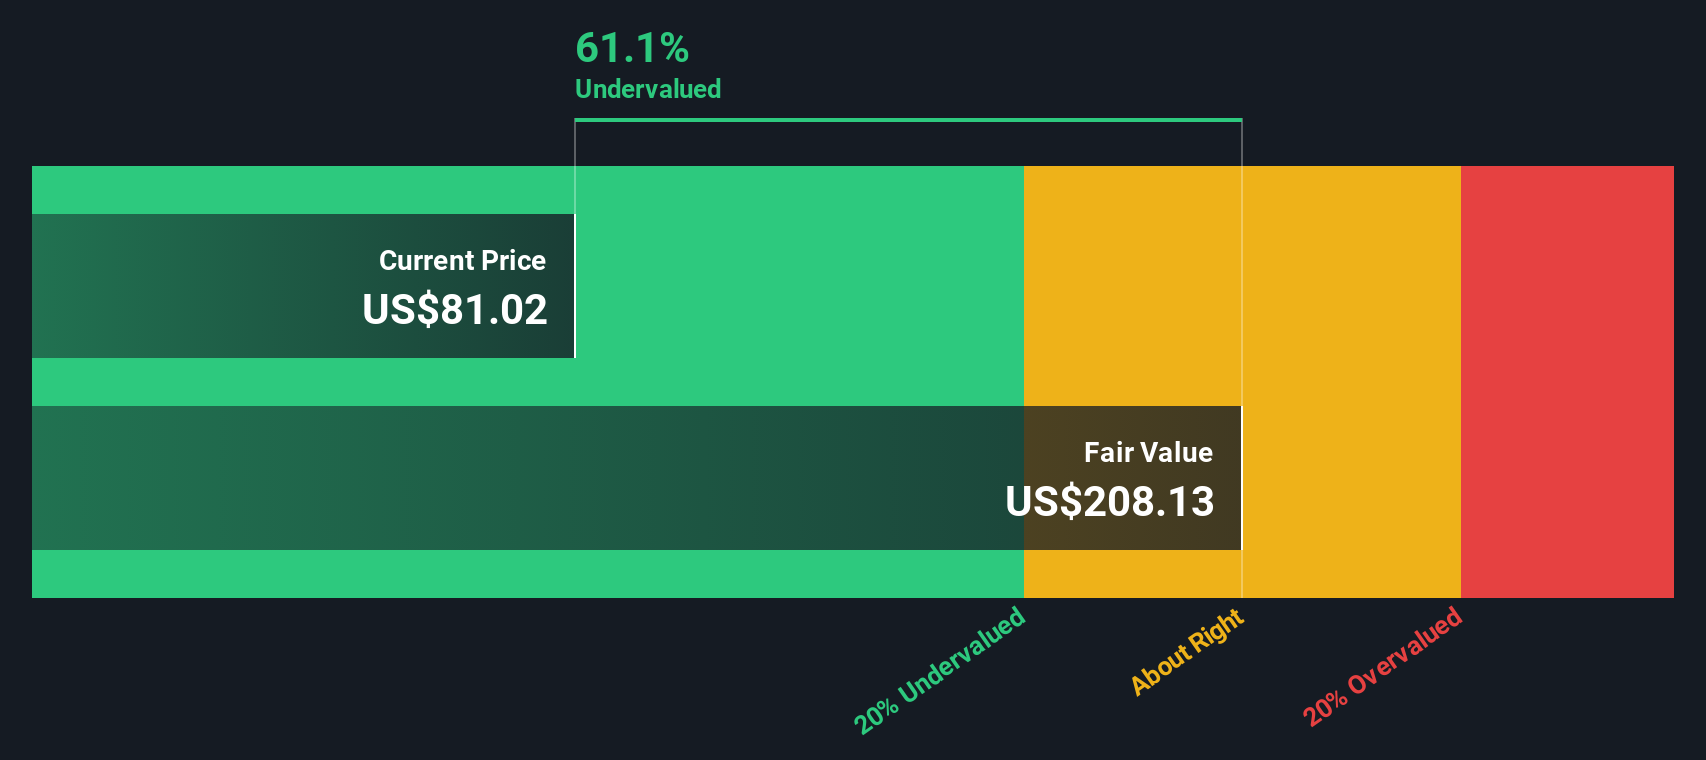
Approach 1: Merck Discounted Cash Flow (DCF) Analysis
A Discounted Cash Flow model takes estimates of the cash a business could generate in the future, and then discounts those cash flows back to today to arrive at an estimate of what the company might be worth at present.
For Merck, the model used is a 2 Stage Free Cash Flow to Equity approach. The latest twelve month free cash flow stands at about US$13.1b. Analyst and extrapolated projections suggest free cash flow in individual future years in the US$20b to US$26b range, with an example estimate of US$22.8b in 2030, all in US$ terms.
When these projected cash flows are discounted back and aggregated, the model arrives at an estimated intrinsic value of US$201.47 per share. Compared with the recent share price of US$108.60, this calculation suggests the stock is 46.1% undervalued according to this specific DCF setup.
Result: UNDERVALUED
Our Discounted Cash Flow (DCF) analysis suggests Merck is undervalued by 46.1%. Track this in your watchlist or portfolio, or discover 883 more undervalued stocks based on cash flows.
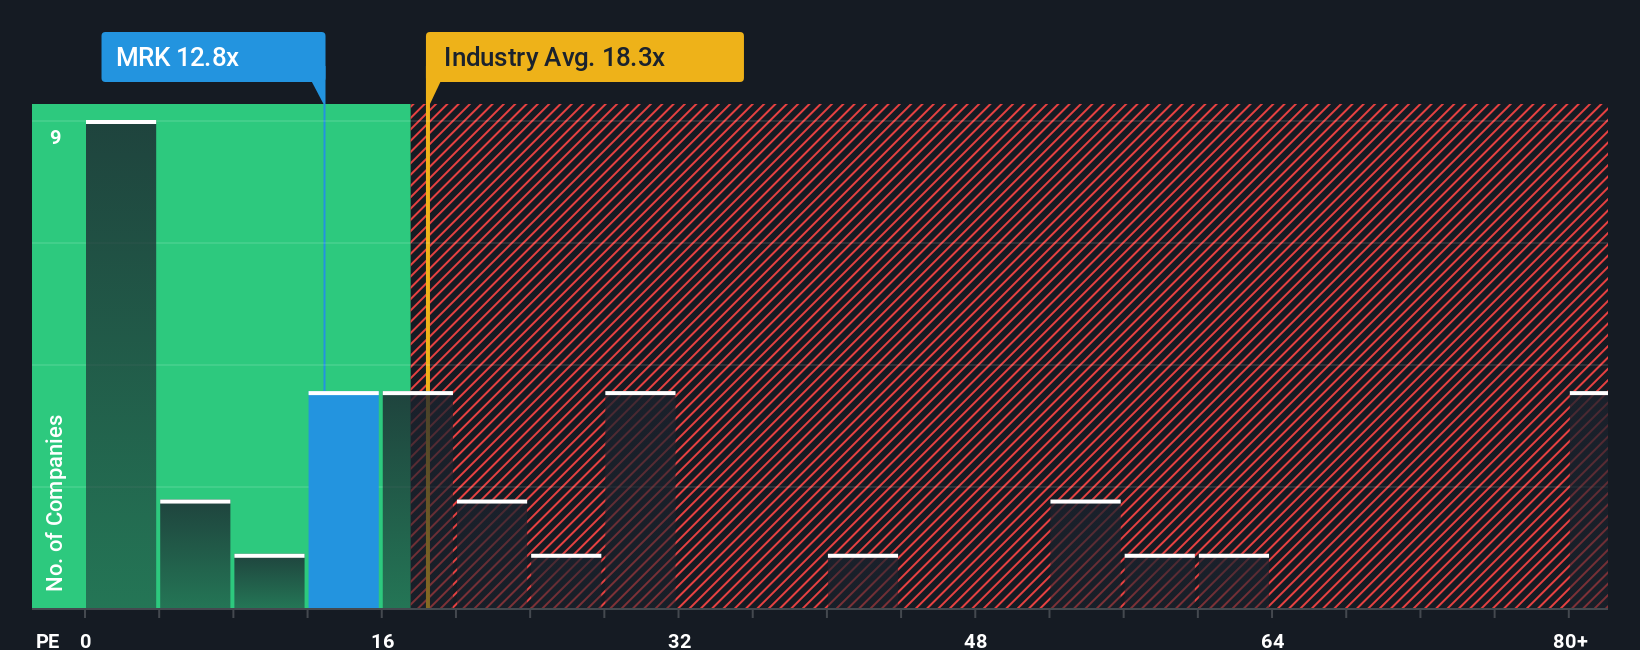
Approach 2: Merck Price vs Earnings
For a profitable company like Merck, the P/E ratio is a useful way to see how much you are paying for each dollar of earnings. It helps you compare the share price to what the business is currently generating, which is often more intuitive than cash flow models for many investors.
A "normal" or "fair" P/E tends to be influenced by how quickly earnings are expected to grow and how risky those earnings are. Higher expected growth or lower perceived risk can justify a higher P/E, while slower growth or higher risk usually calls for a lower multiple.
Merck currently trades on a P/E of 14.16x. This sits below the Pharmaceuticals industry average of 19.90x and also below a peer group average of 18.65x. Simply Wall St's proprietary Fair Ratio for Merck is 29.06x. The Fair Ratio is designed to reflect the P/E you might expect when you factor in elements such as earnings growth, industry, profit margins, market cap and company specific risks.
Because the Fair Ratio builds in these company level characteristics, it can be more informative than a simple comparison against peers or the broad industry. Comparing Merck's current P/E of 14.16x with its Fair Ratio of 29.06x suggests the stock is trading below where this framework would place it.
Result: UNDERVALUED
P/E ratios tell one story, but what if the real opportunity lies elsewhere? Discover 1446 companies where insiders are betting big on explosive growth.
Upgrade Your Decision Making: Choose your Merck Narrative
Earlier we mentioned that there is an even better way to think about valuation. On Simply Wall St's Community page that means using Narratives, where you write a clear story about Merck, link that story to your own revenue, earnings and margin forecasts, and arrive at a Fair Value you can compare with the current price. The platform updates your view as new news or earnings arrive. One investor might build a more optimistic Merck Narrative around the higher US$141 price target, while another leans on the more cautious US$82 view, both using the same tool to decide how the gap between their Fair Value and today's price influences their buy or sell decisions.
Do you think there's more to the story for Merck? Head over to our Community to see what others are saying!

This article by Simply Wall St is general in nature. We provide commentary based on historical data and analyst forecasts only using an unbiased methodology and our articles are not intended to be financial advice. It does not constitute a recommendation to buy or sell any stock, and does not take account of your objectives, or your financial situation. We aim to bring you long-term focused analysis driven by fundamental data. Note that our analysis may not factor in the latest price-sensitive company announcements or qualitative material. Simply Wall St has no position in any stocks mentioned.
Have feedback on this article? Concerned about the content? Get in touch with us directly. Alternatively, email editorial-team@simplywallst.com