
 Nasdaq
 华尔街日报
华尔街日报Does Ternium (NYSE:TX) Still Offer Value After Its Strong One Year Share Price Gain
- If you are wondering whether Ternium’s share price still lines up with its underlying value, you are not alone. This article focuses on what the current market price might be implying.
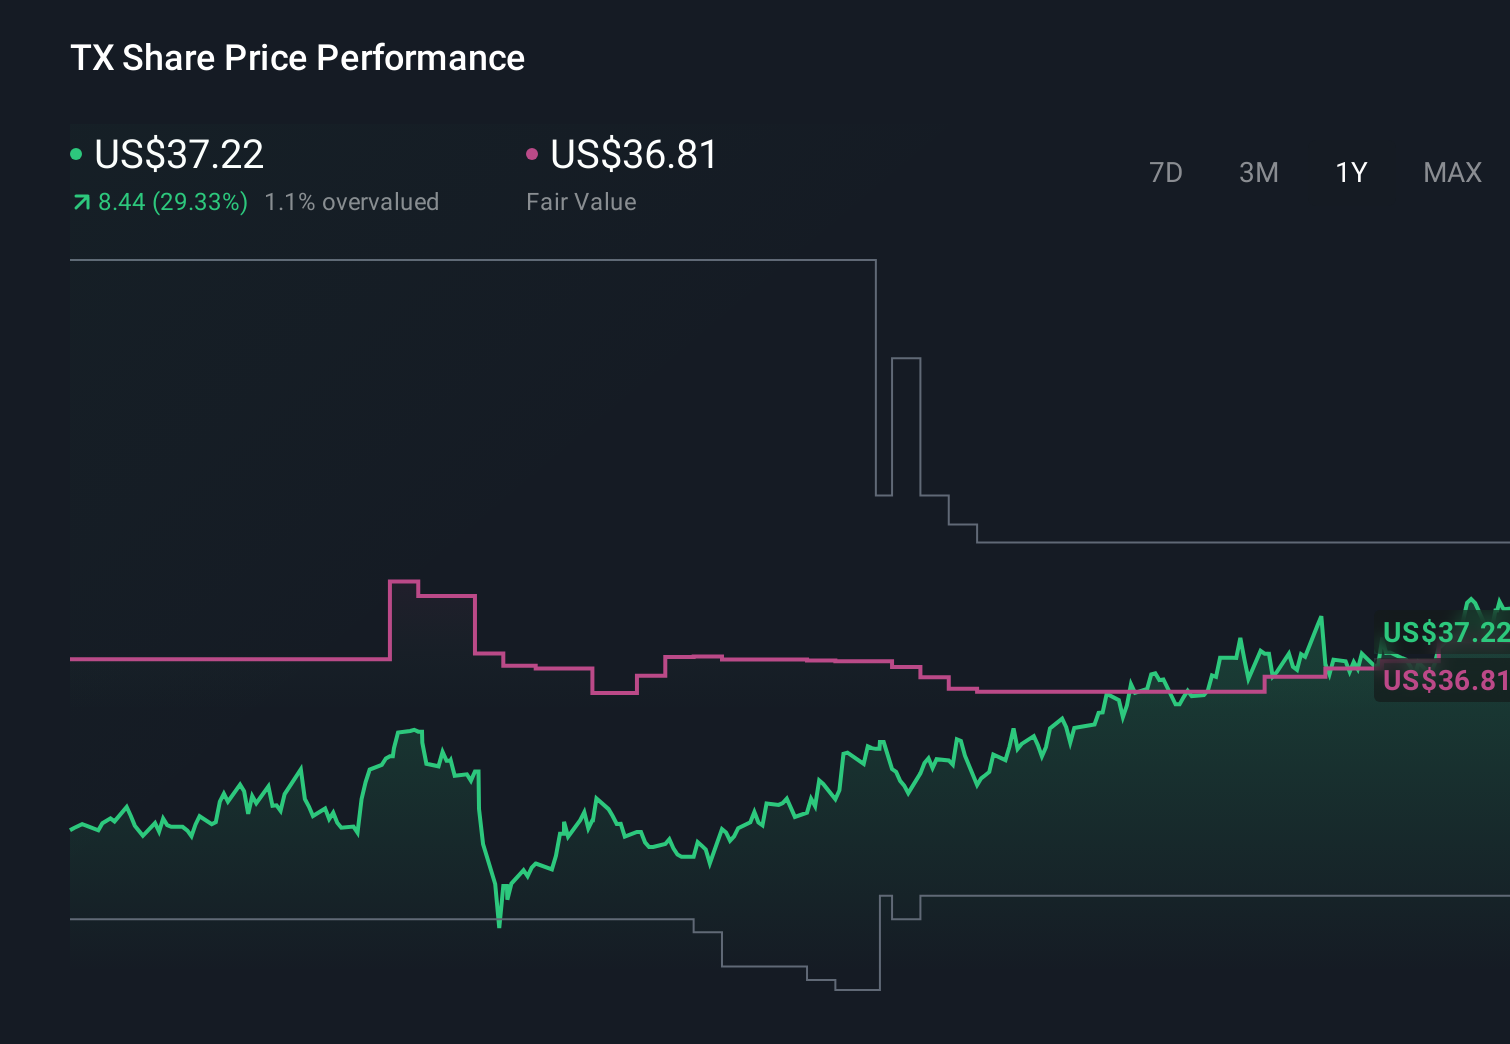
- Ternium’s stock last closed at US$40.67, with returns of 6.5% over 7 days, 9.1% over 30 days, 3.9% year to date, 53.4% over 1 year and 88.4% over 5 years. This naturally raises questions about how much value is already reflected in the price.
- Recent attention on Ternium has centered on how it fits into the broader materials sector and what that means for investor sentiment, especially with share price moves that stand out over the past year. Coverage has focused on how the company is positioned in steel production and what that could mean for its long term role in the industry.
- Ternium currently has a valuation score of 5/6, suggesting that several of the standard valuation checks point to possible mispricing. Next we will compare different valuation approaches before finishing with a way to judge value that can give you a deeper read on the stock.
Find out why Ternium's 53.4% return over the last year is lagging behind its peers.
Approach 1: Ternium Discounted Cash Flow (DCF) Analysis
A Discounted Cash Flow model estimates what a company might be worth by projecting its future cash flows and discounting them back to today, so you can compare that value with the current share price.
For Ternium, the model used is a 2 Stage Free Cash Flow to Equity approach, based on cash flows in US$. The latest twelve month free cash flow is about $544.2 million. Analyst inputs cover the next few years, then Simply Wall St extrapolates further out, with projected free cash flow of $1,002 million in 2030. The longer term path includes years with both positive and negative free cash flow projections. This is reflected in the discounted values in the model.
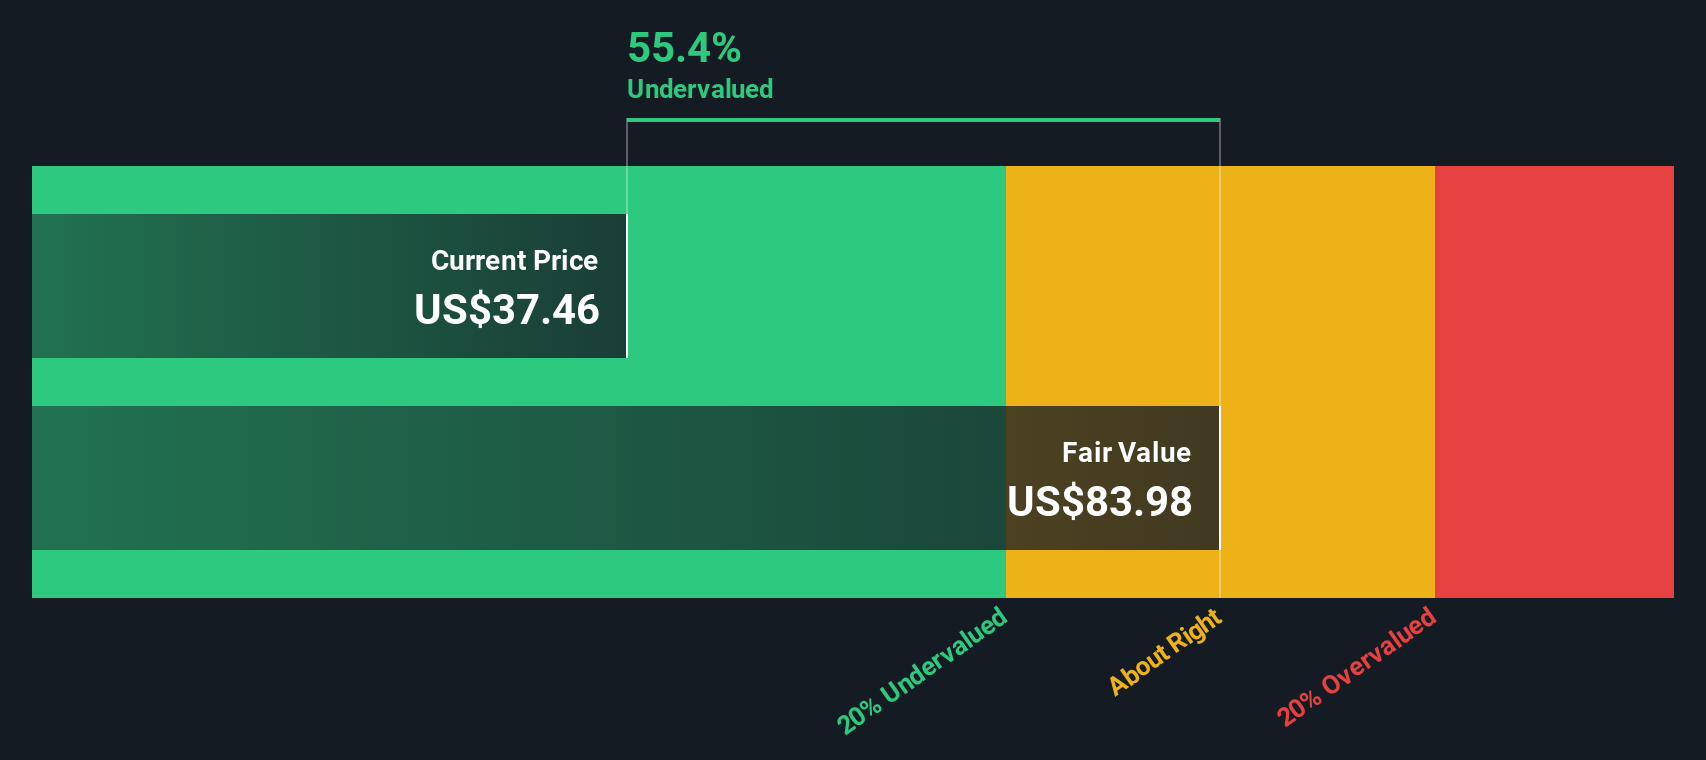
Putting all of these discounted cash flows together, the model arrives at an estimated intrinsic value of about US$87.96 per share. Compared with the recent share price of US$40.67, this implies the stock is around 53.8% undervalued on this DCF view.
Result: UNDERVALUED
Our Discounted Cash Flow (DCF) analysis suggests Ternium is undervalued by 53.8%. Track this in your watchlist or portfolio, or discover 883 more undervalued stocks based on cash flows.
Approach 2: Ternium Price vs Earnings
For a profitable company like Ternium, the P/E ratio is a useful way to think about value because it links what you pay for each share directly to the earnings that support it. The level of P/E that investors usually see as “normal” tends to reflect what they expect for future earnings growth and how much risk they see in those earnings.
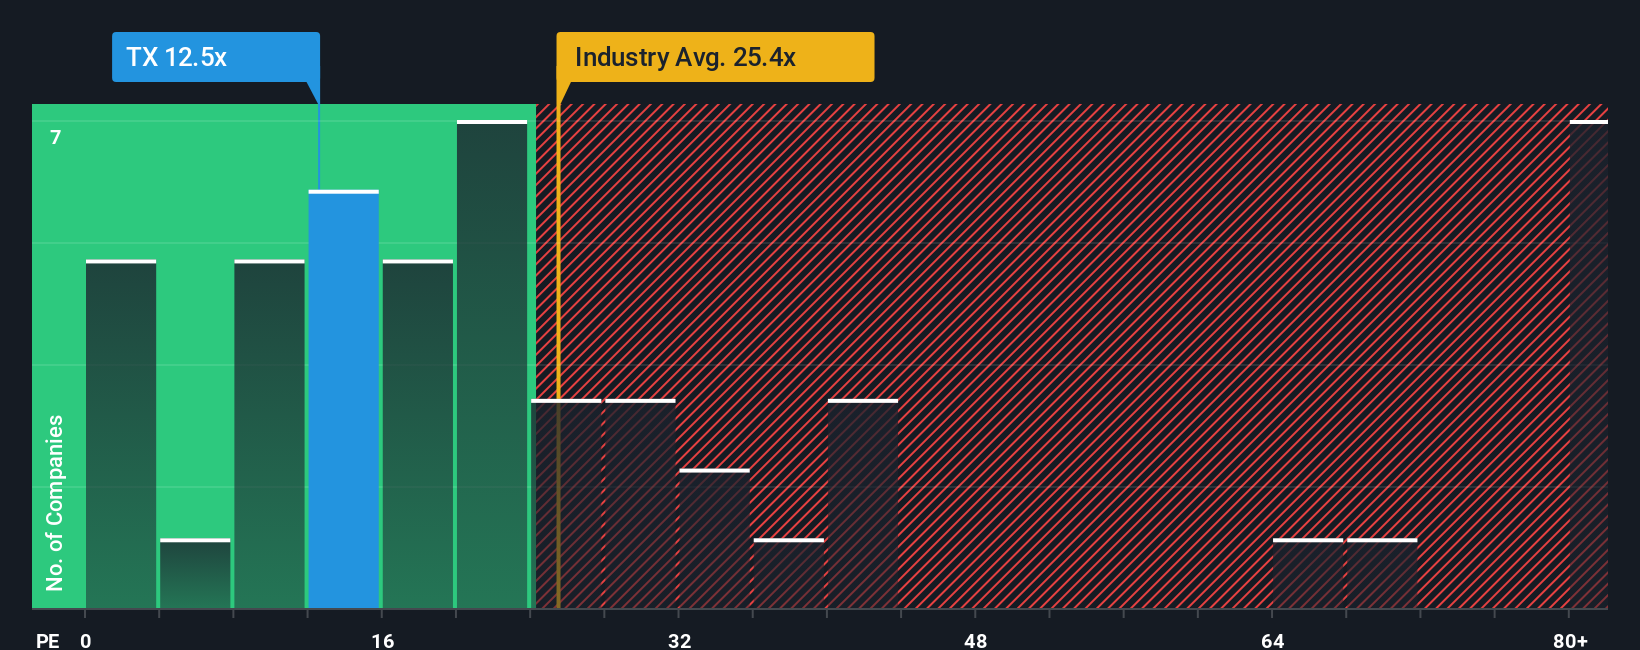
Ternium currently trades on a P/E of 13.67x. That sits below the Metals and Mining industry average P/E of 26.51x and also well below the peer group average of 71.59x. Simply Wall St’s Fair Ratio for Ternium is 23.45x. This Fair Ratio is a proprietary estimate of what P/E might make sense given the company’s earnings growth profile, industry, profit margins, market cap and specific risks.
Compared with simple peer or industry comparisons, the Fair Ratio is designed to be more tailored because it adjusts for those company specific factors rather than assuming that all steel or metals companies should trade on the same multiple. Putting this together, Ternium’s current P/E of 13.67x sits below the Fair Ratio of 23.45x, which indicates that the shares may be undervalued on this metric.
Result: UNDERVALUED
P/E ratios tell one story, but what if the real opportunity lies elsewhere? Discover 1446 companies where insiders are betting big on explosive growth.
Upgrade Your Decision Making: Choose your Ternium Narrative
Earlier we mentioned that there is an even better way to understand valuation, so let us introduce you to Narratives, which are simply your story about a company tied directly to numbers like fair value, future revenue, earnings and margins, all built into a forecast that you can compare with today’s price.
On Simply Wall St’s Community page, Narratives let you set out your own view, connect that story to a financial model, see the fair value that falls out of those assumptions and then quickly compare that to the current Ternium share price to help you decide whether it might be closer to a buy, hold or sell for you.
Narratives are also updated as new information such as earnings or news is incorporated, so your fair value and key assumptions stay current rather than locked in at the time you first looked at the stock.
For example, one Ternium Narrative on the platform currently assumes a fair value of about US$36.81 per share based on revenue growth of roughly 5.63%, a profit margin of about 4.55%, a future P/E near 10.89x and a discount rate around 8.33%, while another user might plug in lower growth or margins, leading to a different fair value and therefore a different view on whether the current market price looks attractive.
Do you think there's more to the story for Ternium? Head over to our Community to see what others are saying!
This article by Simply Wall St is general in nature. We provide commentary based on historical data and analyst forecasts only using an unbiased methodology and our articles are not intended to be financial advice. It does not constitute a recommendation to buy or sell any stock, and does not take account of your objectives, or your financial situation. We aim to bring you long-term focused analysis driven by fundamental data. Note that our analysis may not factor in the latest price-sensitive company announcements or qualitative material. Simply Wall St has no position in any stocks mentioned.
Have feedback on this article? Concerned about the content? Get in touch with us directly. Alternatively, email editorial-team@simplywallst.com