
 Nasdaq
 华尔街日报
华尔街日报Is Banc of California (BANC) Pricing Reflect Its Expanded Banking Platform Integration Efforts?
- If you are looking at Banc of California and wondering whether the current share price gives you good value, this article will walk through what the numbers actually say.
- The stock recently closed at US$20.11, with returns of 4.3% over the past week, 5.0% over the past month, 3.4% year to date and 32.8% over the last year.
- Recent news around Banc of California has focused on ongoing integration of its expanded banking platform and how investors are reacting to changes in the regional banking space. These headlines help frame why the share price has moved the way it has and why valuation is back in focus.
- Right now, Banc of California scores 2 out of 6 on our valuation checks, as shown in its valuation score. Next, we will walk through what different valuation approaches suggest about the stock before finishing with a more complete way to think about value.
Banc of California scores just 2/6 on our valuation checks. See what other red flags we found in the full valuation breakdown.
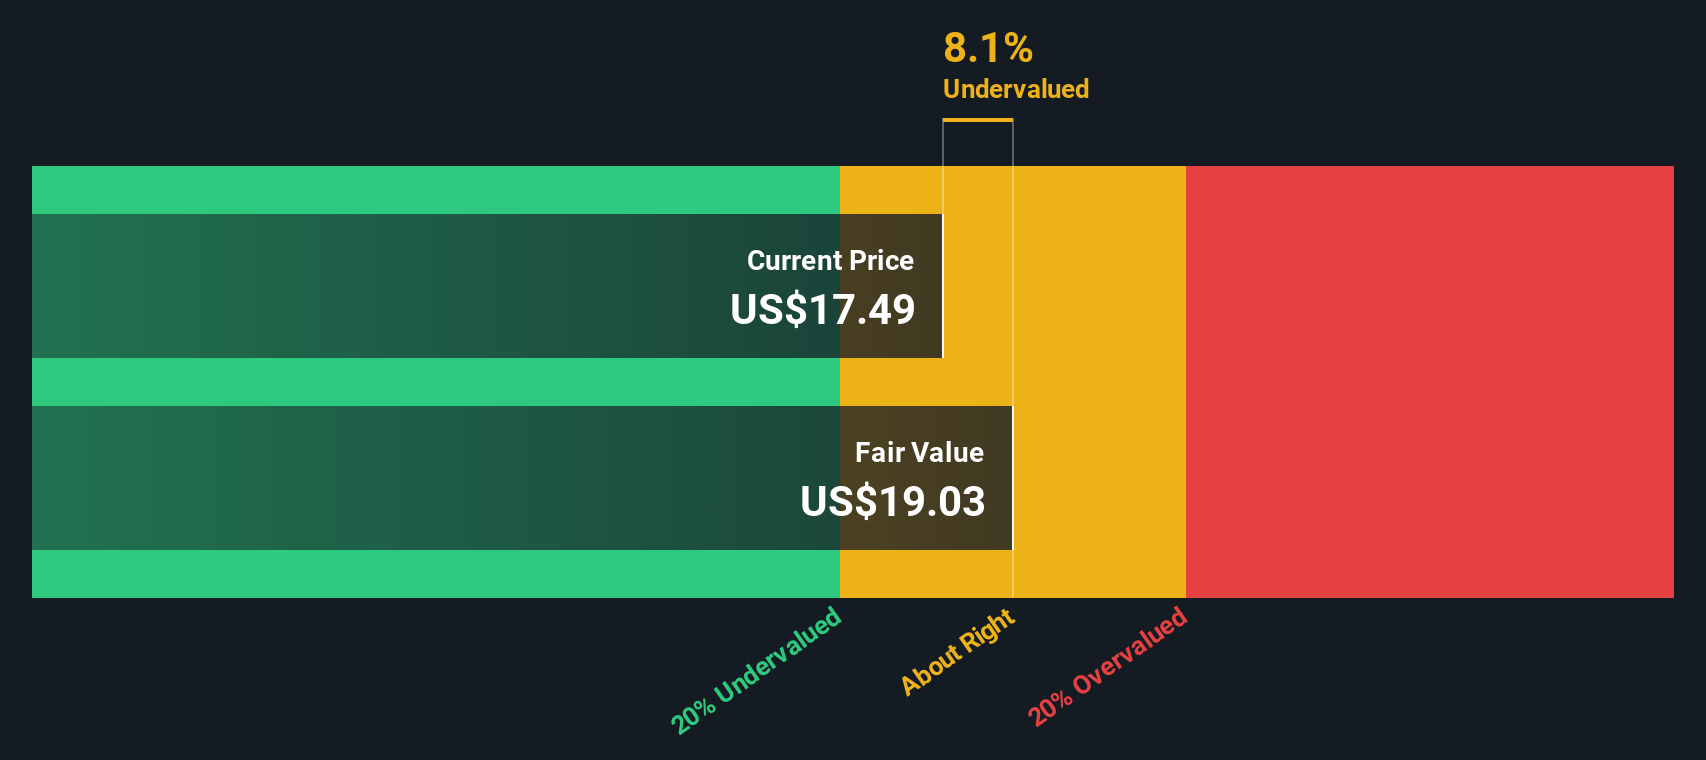
Approach 1: Banc of California Excess Returns Analysis
The Excess Returns model examines how much value Banc of California can generate over and above the return that shareholders require. Instead of focusing on cash flows, it starts with the bank’s equity, what it earns on that equity, and the cost of funding it.
For Banc of California, the model uses a Book Value of US$19.10 per share and a Stable EPS of US$1.98 per share, based on weighted future Return on Equity estimates from 9 analysts. The Average Return on Equity is 8.94%, while the Cost of Equity is US$1.72 per share. The difference between what the bank is expected to earn and what investors require is the Excess Return, which in this case is US$0.26 per share.
The analysis also assumes a Stable Book Value of US$22.15 per share, sourced from weighted future Book Value estimates from 8 analysts. When these excess returns are capitalized, the model arrives at an estimated intrinsic value of about US$27.95 per share, which implies the stock is 28.1% undervalued relative to the recent price of US$20.11.
Result: UNDERVALUED
Our Excess Returns analysis suggests Banc of California is undervalued by 28.1%. Track this in your watchlist or portfolio, or discover 883 more undervalued stocks based on cash flows.
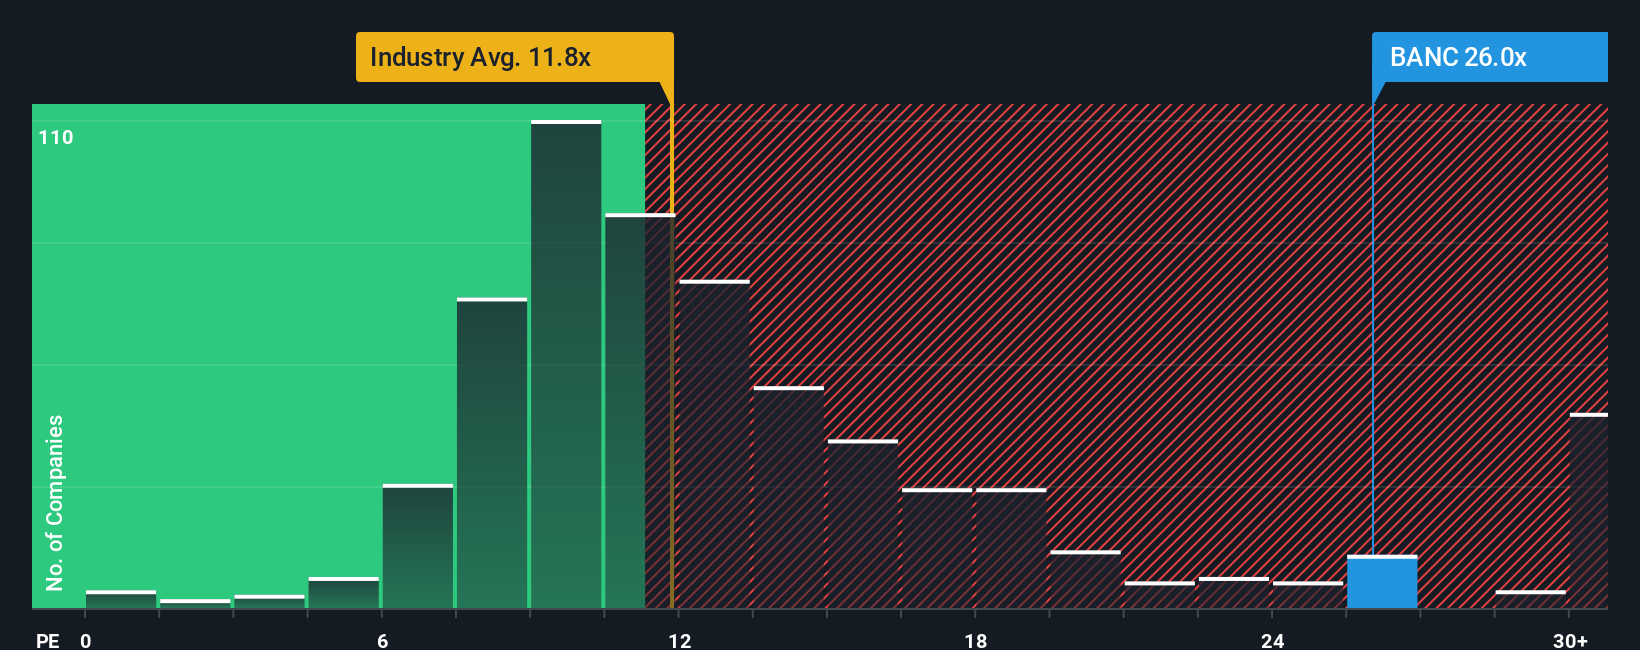
Approach 2: Banc of California Price vs Earnings
For a profitable company like Banc of California, the P/E ratio is a useful way to think about what you are paying for each dollar of earnings. It helps you compare the share price to the underlying earnings power of the bank in a single, intuitive number.
What counts as a "fair" P/E depends on how the market views growth potential and risk. Higher expected growth or lower perceived risk can support a higher P/E, while weaker growth or higher risk usually justifies a lower one.
Banc of California currently trades on a P/E of 18.53x. That sits above the Banks industry average of 11.87x and the peer group average of 14.48x. Simply Wall St also calculates a Fair Ratio of 17.43x for Banc of California. This Fair Ratio is a proprietary view of what the P/E could be, based on factors such as the company’s earnings profile, its industry, profit margins, market value and key risks.
Compared with simple industry or peer comparisons, the Fair Ratio aims to be more tailored, because it looks at the company’s specific characteristics rather than just broad group averages. With the current P/E of 18.53x versus the Fair Ratio of 17.43x, the shares look slightly expensive on this metric.
Result: OVERVALUED
P/E ratios tell one story, but what if the real opportunity lies elsewhere? Discover 1446 companies where insiders are betting big on explosive growth.
Upgrade Your Decision Making: Choose your Banc of California Narrative
Earlier we mentioned that there is an even better way to understand valuation. Let us introduce you to Narratives, which are simple stories that you and other investors build around Banc of California. These Narratives link your view on its banking platform, digital progress, risks and opportunities to a concrete forecast for revenue, earnings, margins and a fair value estimate. You can then compare that estimate directly to today’s share price within the Narratives section on Simply Wall St’s Community page, which is used by millions of investors. Each Narrative updates automatically as new earnings or news arrives. One investor might focus on digital growth, California demographics, merger integration and share repurchases and conclude a higher fair value such as US$22.14. Another might focus on regional commercial real estate exposure, deposit competition, integration costs and fintech disruption and anchor closer to the lower analyst target of US$15.00. This gives you a clear, numbers backed way to decide whether the current price feels attractive or not based on the story you believe.
Do you think there's more to the story for Banc of California? Head over to our Community to see what others are saying!

This article by Simply Wall St is general in nature. We provide commentary based on historical data and analyst forecasts only using an unbiased methodology and our articles are not intended to be financial advice. It does not constitute a recommendation to buy or sell any stock, and does not take account of your objectives, or your financial situation. We aim to bring you long-term focused analysis driven by fundamental data. Note that our analysis may not factor in the latest price-sensitive company announcements or qualitative material. Simply Wall St has no position in any stocks mentioned.
Have feedback on this article? Concerned about the content? Get in touch with us directly. Alternatively, email editorial-team@simplywallst.com