
 Nasdaq
 华尔街日报
华尔街日报Is It Time To Reconsider T. Rowe Price (TROW) After Years Of Weak Share Returns?
- If you are considering whether T. Rowe Price Group at around US$106 offers good value right now, this article explains what the current price might be implying and how that compares with different valuation checks.
- The stock has returned 3.5% over the last 7 days, 1.4% over the last 30 days, 1.3% year to date, and shows a 1% decline over 1 year and a 16% decline over 5 years. These figures can shape how you think about its risk and opportunity today.
- Recent attention around T. Rowe Price Group has focused on its role as a large US asset manager. Investors are weighing how its business model responds to shifts in client assets and market sentiment. This context can influence how the market reacts to fund flow updates, product launches or regulatory developments tied to the broader investment management industry.
- T. Rowe Price Group currently has a valuation score of 5/6. We will break this down using several standard valuation approaches, and then finish with a more holistic way to think about what the market might be pricing in.
Find out why T. Rowe Price Group's -1.1% return over the last year is lagging behind its peers.
Approach 1: T. Rowe Price Group Excess Returns Analysis
The Excess Returns model asks a simple question: is T. Rowe Price Group earning more on shareholders’ equity than it costs to provide that equity, and how long can that gap persist? It looks at returns on equity and book value to estimate what that stream of surplus earnings could be worth today.
For T. Rowe Price Group, the model uses a Book Value of $49.45 per share and a Stable EPS of $9.47 per share, based on the median return on equity from the past 5 years. The Average Return on Equity is 18.63%, compared with a Cost of Equity of $4.13 per share, which leads to an Excess Return of $5.34 per share. The Stable Book Value input is $50.81 per share, drawn from weighted future book value estimates from 2 analysts.
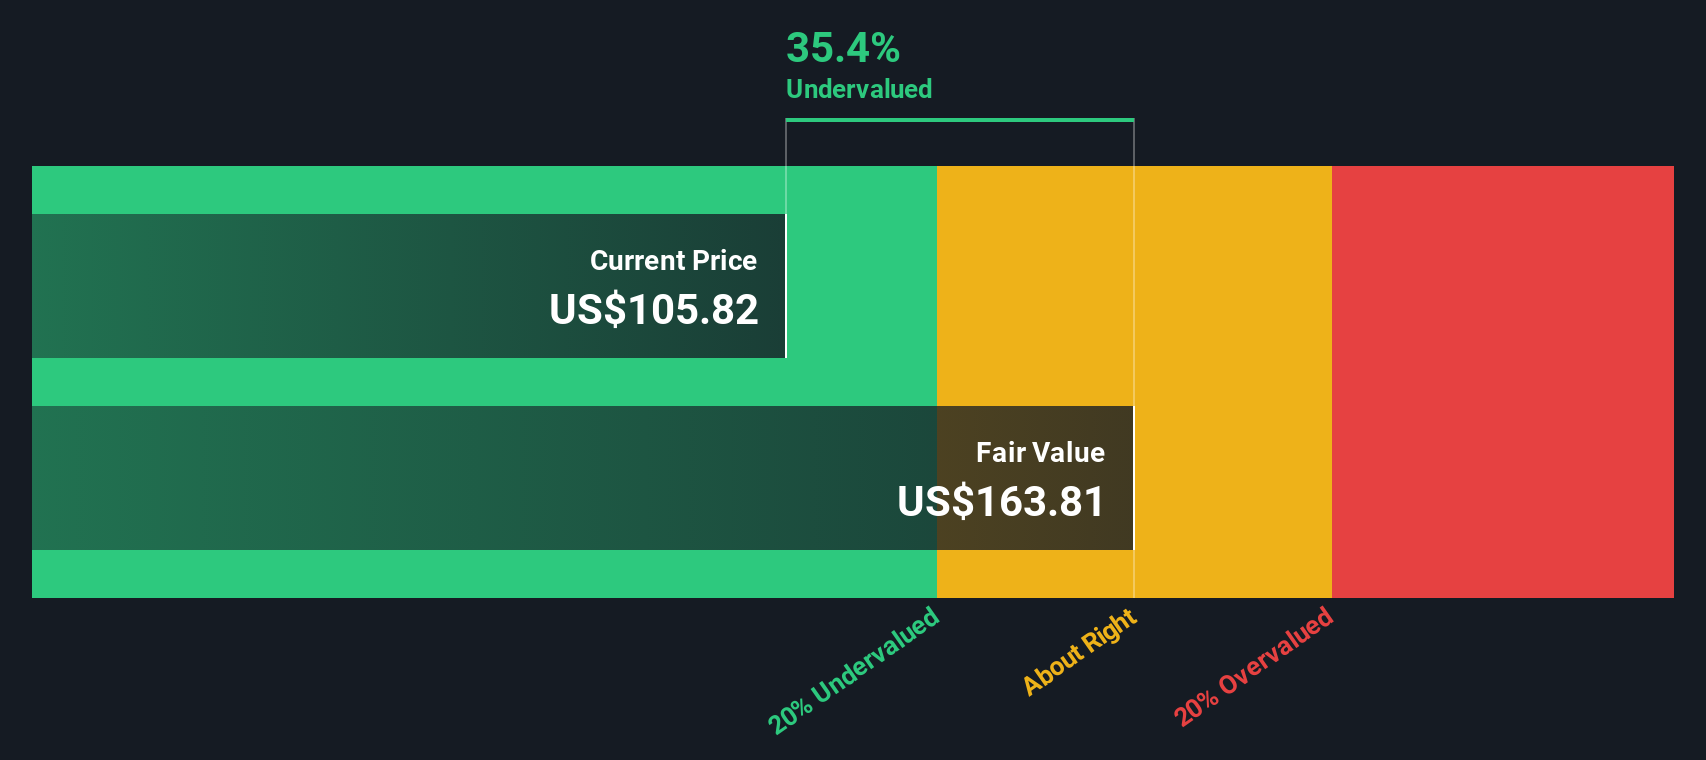
Putting these pieces together, the Excess Returns valuation produces an estimated intrinsic value of about $160.60 per share. Versus a current share price around $106, this implies the stock is about 34.0% undervalued on this model.
Result: UNDERVALUED
Our Excess Returns analysis suggests T. Rowe Price Group is undervalued by 34.0%. Track this in your watchlist or portfolio, or discover 883 more undervalued stocks based on cash flows.
Approach 2: T. Rowe Price Group Price vs Earnings
For a profitable company like T. Rowe Price Group, the P/E ratio is a useful way to think about what you are paying for each dollar of earnings today. It ties the share price directly to current earnings, which is often how many investors frame what feels reasonable to pay for an established, income generating business.
What counts as a normal or fair P/E ratio usually reflects two things: how quickly earnings are expected to change and how risky those earnings appear. Higher expected growth or more resilient earnings can support a higher multiple, while higher perceived risk or weaker earnings quality tends to justify a lower one.
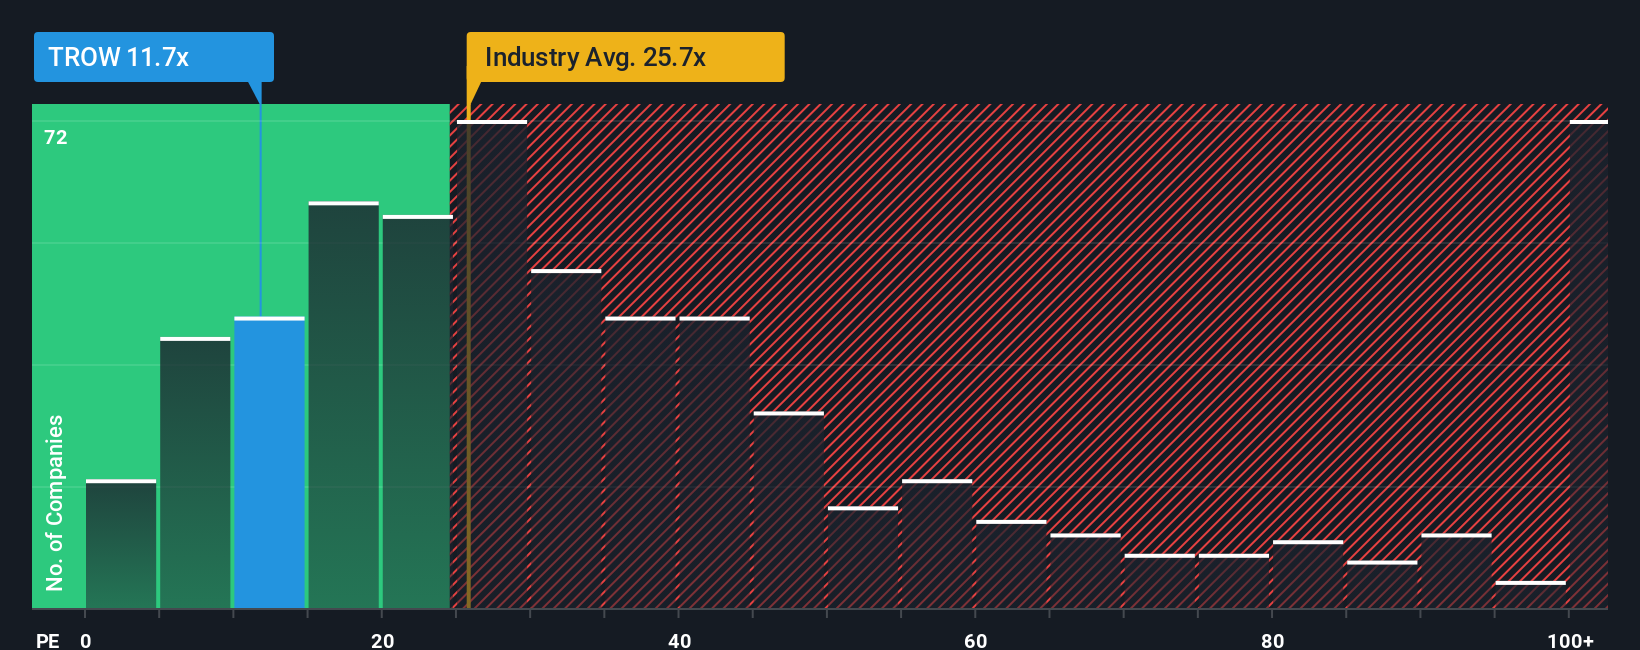
T. Rowe Price Group is trading at a P/E of 11.39x. This sits well below the Capital Markets industry average P/E of 25.77x and the peer group average of 65.96x. Simply Wall St’s Fair Ratio for T. Rowe Price Group is 16.25x, which is a proprietary estimate of what the P/E might be given its earnings profile, industry, margins, size and risk factors. This Fair Ratio can be more informative than a simple peer or industry comparison because it adjusts for those company specific characteristics. Since the current 11.39x P/E is below the 16.25x Fair Ratio, T. Rowe Price Group screens as undervalued on this metric.
Result: UNDERVALUED
P/E ratios tell one story, but what if the real opportunity lies elsewhere? Discover 1446 companies where insiders are betting big on explosive growth.
Upgrade Your Decision Making: Choose your T. Rowe Price Group Narrative
Earlier we mentioned that there is an even better way to understand valuation, so let us introduce you to Narratives. With Narratives you spell out your story for T. Rowe Price Group, link that story to explicit forecasts for revenue, earnings and margins, and then see a fair value that updates automatically on Simply Wall St’s Community page as new news or earnings arrive. This means you can compare that fair value to the current price to judge whether the stock looks attractive or stretched based on your own assumptions. You can also see how different investors can reasonably disagree, with one Narrative built around the higher US$116 analyst target that leans on efforts in ETFs, retirement products and expense management, and another anchored near the US$91 target that focuses more on fee pressure, fund outflows and competition.
Do you think there's more to the story for T. Rowe Price Group? Head over to our Community to see what others are saying!

This article by Simply Wall St is general in nature. We provide commentary based on historical data and analyst forecasts only using an unbiased methodology and our articles are not intended to be financial advice. It does not constitute a recommendation to buy or sell any stock, and does not take account of your objectives, or your financial situation. We aim to bring you long-term focused analysis driven by fundamental data. Note that our analysis may not factor in the latest price-sensitive company announcements or qualitative material. Simply Wall St has no position in any stocks mentioned.
Have feedback on this article? Concerned about the content? Get in touch with us directly. Alternatively, email editorial-team@simplywallst.com