
 Nasdaq
 华尔街日报
华尔街日报Is BP (LSE:BP.) Offering Value After Recent Share Price Weakness?
- If you are wondering whether BP shares offer value at today's price, it helps to line up what the recent share performance and current valuation are really telling you.
- Over the last week the share price is down 4.0%, over the last month it is down 6.8%, year to date it is down 5.1%, while the 1 year return sits at 4.1% and the 5 year return at 72.5%.
- These mixed returns sit against an ongoing debate about how investors should think about large integrated energy companies like BP, including their exposure to traditional oil and gas alongside low carbon projects. That context matters because shifts in sentiment around energy transition policy, commodity prices or capital allocation plans can quickly influence how the market prices BP.
- Our valuation checks give BP a score of 2 out of 6. This suggests some parts of the market's pricing look more attractive than others. It also sets up a closer look at methods like discounted cash flow and multiples, before we finish with a simpler way to frame BP's valuation story that many investors find more intuitive.
BP scores just 2/6 on our valuation checks. See what other red flags we found in the full valuation breakdown.
Approach 1: BP Discounted Cash Flow (DCF) Analysis
A Discounted Cash Flow, or DCF, model projects a company’s future cash flows and then discounts them back to today to estimate what the business might reasonably be worth right now.
For BP, the model used is a 2 Stage Free Cash Flow to Equity approach based on cash flow projections. The latest twelve month free cash flow is about US$11.1b, and analysts plus Simply Wall St projections extend this out to an estimated US$12.0b in 2030. Interim years step through figures such as US$12.7b in 2026 and US$10.8b to US$12.1b in the early 2030s. Early years are based on analyst estimates, while later years are extrapolated.
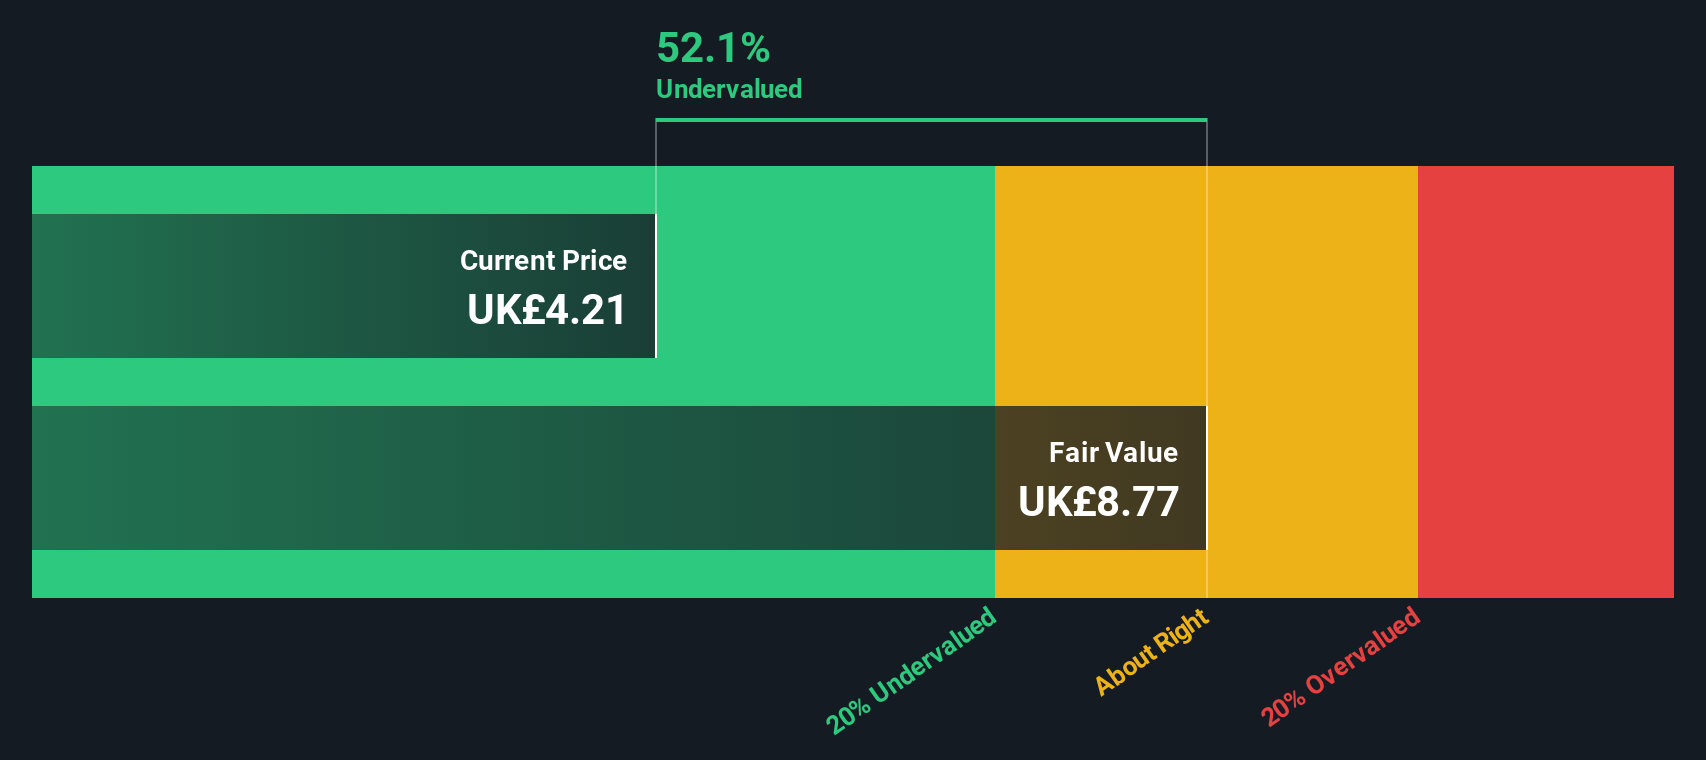
Discounting these projected cash flows back to today gives an estimated intrinsic value of £10.48 per share. Versus the current share price, this implies a 60.3% discount, which points to the market pricing BP below this DCF based estimate.
Result: UNDERVALUED
Our Discounted Cash Flow (DCF) analysis suggests BP is undervalued by 60.3%. Track this in your watchlist or portfolio, or discover 883 more undervalued stocks based on cash flows.
Approach 2: BP Price vs Earnings
For a profitable company like BP, the P/E ratio is a useful shorthand because it links what you pay today with the earnings the business is already generating. Investors usually expect higher growth or lower risk to justify a higher P/E, while slower growth or higher risk tends to line up with a lower, more cautious P/E.
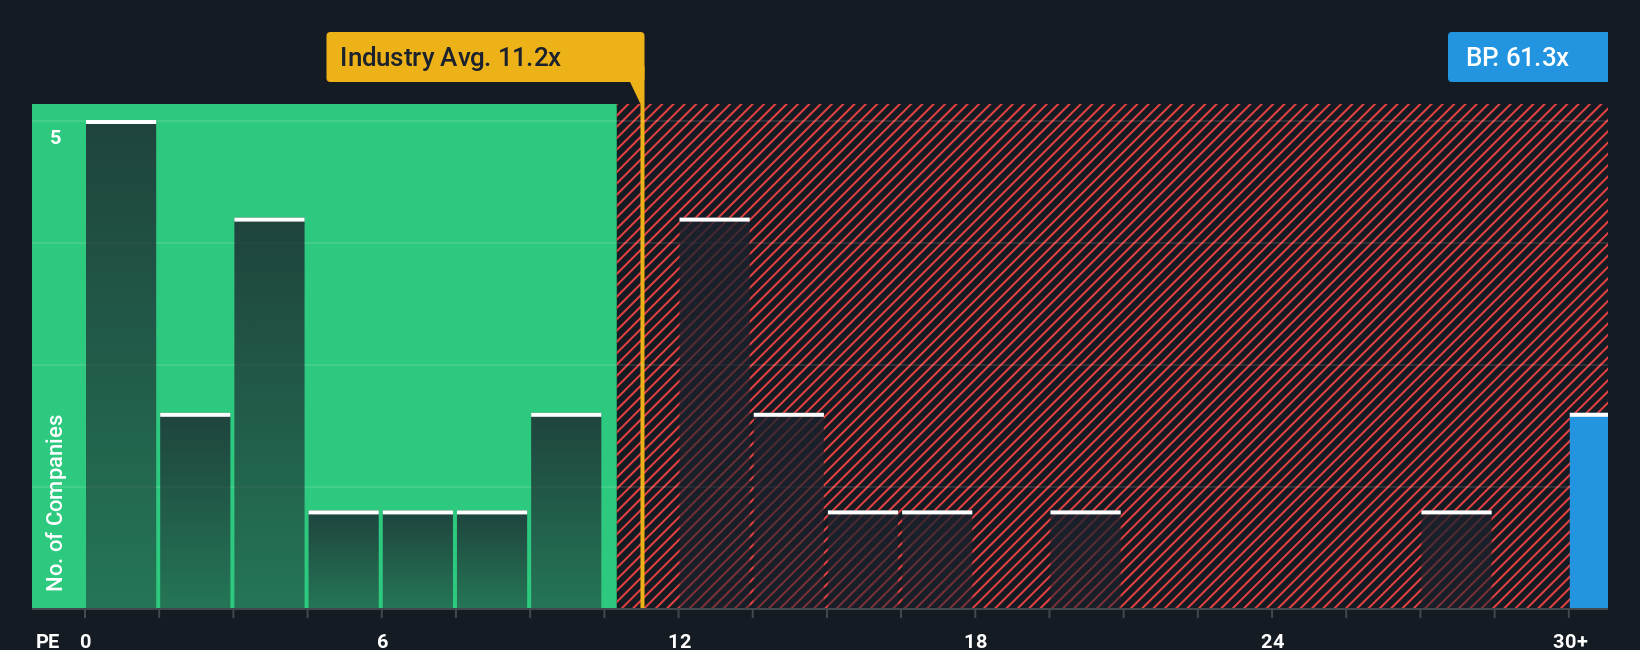
BP currently trades on a P/E of 56.32x. That sits above the Oil and Gas industry average of 13.27x and the peer group average of 11.01x. This tells you the market is putting a richer price on BP's earnings than on many of its sector peers.
Simply Wall St's Fair Ratio for BP is 19.14x. This is a proprietary estimate of what a reasonable P/E might look like after accounting for factors such as earnings growth characteristics, the company's industry, profit margins, market cap and specific risks. Because it blends these elements, the Fair Ratio can be a more tailored guide than a simple comparison to industry or peer averages.
Set against the current 56.32x P/E, the 19.14x Fair Ratio points to BP trading at a higher multiple than this framework would suggest.
Result: OVERVALUED
P/E ratios tell one story, but what if the real opportunity lies elsewhere? Discover 1446 companies where insiders are betting big on explosive growth.
Upgrade Your Decision Making: Choose your BP Narrative
Earlier we mentioned that there is an even better way to understand valuation. Let us introduce you to Narratives, which are simply your story about BP connected to hard numbers like expected revenue, earnings, margins and a fair value that you can compare to today’s price. All of this is built into an easy tool on Simply Wall St’s Community page that is used by millions of investors and updates automatically when new information such as news or earnings arrives. One investor might create a BP Narrative that leans into the higher £5.20 analyst target with assumptions that support stronger margins and a higher fair value, while another might anchor on the £3.82 target with more cautious estimates. By setting up your own version, you can see on one screen whether your fair value is above or below the current share price and use that gap to help decide if BP looks closer to a buy, a hold or a sell for you.
Do you think there's more to the story for BP? Head over to our Community to see what others are saying!

This article by Simply Wall St is general in nature. We provide commentary based on historical data and analyst forecasts only using an unbiased methodology and our articles are not intended to be financial advice. It does not constitute a recommendation to buy or sell any stock, and does not take account of your objectives, or your financial situation. We aim to bring you long-term focused analysis driven by fundamental data. Note that our analysis may not factor in the latest price-sensitive company announcements or qualitative material. Simply Wall St has no position in any stocks mentioned.
Have feedback on this article? Concerned about the content? Get in touch with us directly. Alternatively, email editorial-team@simplywallst.com