
 Nasdaq
 华尔街日报
华尔街日报Is MaxLinear (MXL) Pricing Look Attractive After Recent Share Price Weakness
- If you are wondering whether MaxLinear's current share price reflects its underlying value, this article will walk through the key numbers so you can judge that for yourself.
- The stock last closed at US$18.65, with returns of 7.0% over the past week, a 4.4% decline over the past month, 0.8% year to date, and longer term returns of a 9.2% decline over 1 year, a 48.8% decline over 3 years, and a 49.5% decline over 5 years.
- These mixed returns have kept MaxLinear on the radar of investors who are weighing short term moves against a longer term share price record. In that context, it can be useful to focus on what the current valuation is actually saying, rather than only looking at the chart.
- On Simply Wall St's valuation model, MaxLinear scores 4 out of 6 on the undervaluation checks. Next, we will walk through the main valuation approaches used, then finish by looking at a simple way to pull all those signals together.
Find out why MaxLinear's -9.2% return over the last year is lagging behind its peers.
Approach 1: MaxLinear Discounted Cash Flow (DCF) Analysis
A Discounted Cash Flow, or DCF, model estimates what a business might be worth today by projecting its future cash flows and discounting them back to a present value. It is essentially asking what all those future dollars are worth in today's terms.
For MaxLinear, the model used is a 2 Stage Free Cash Flow to Equity approach, based on cash flows in $. The latest twelve month free cash flow is a loss of $38.01 million, so the starting point is currently negative. Analysts provide free cash flow estimates out to 2028 and Simply Wall St then extrapolates further. For 2028, the projected free cash flow is $110 million, and by 2035 the extrapolated figure in the model is $272.92 million, with each year between 2026 and 2035 discounted back to today.
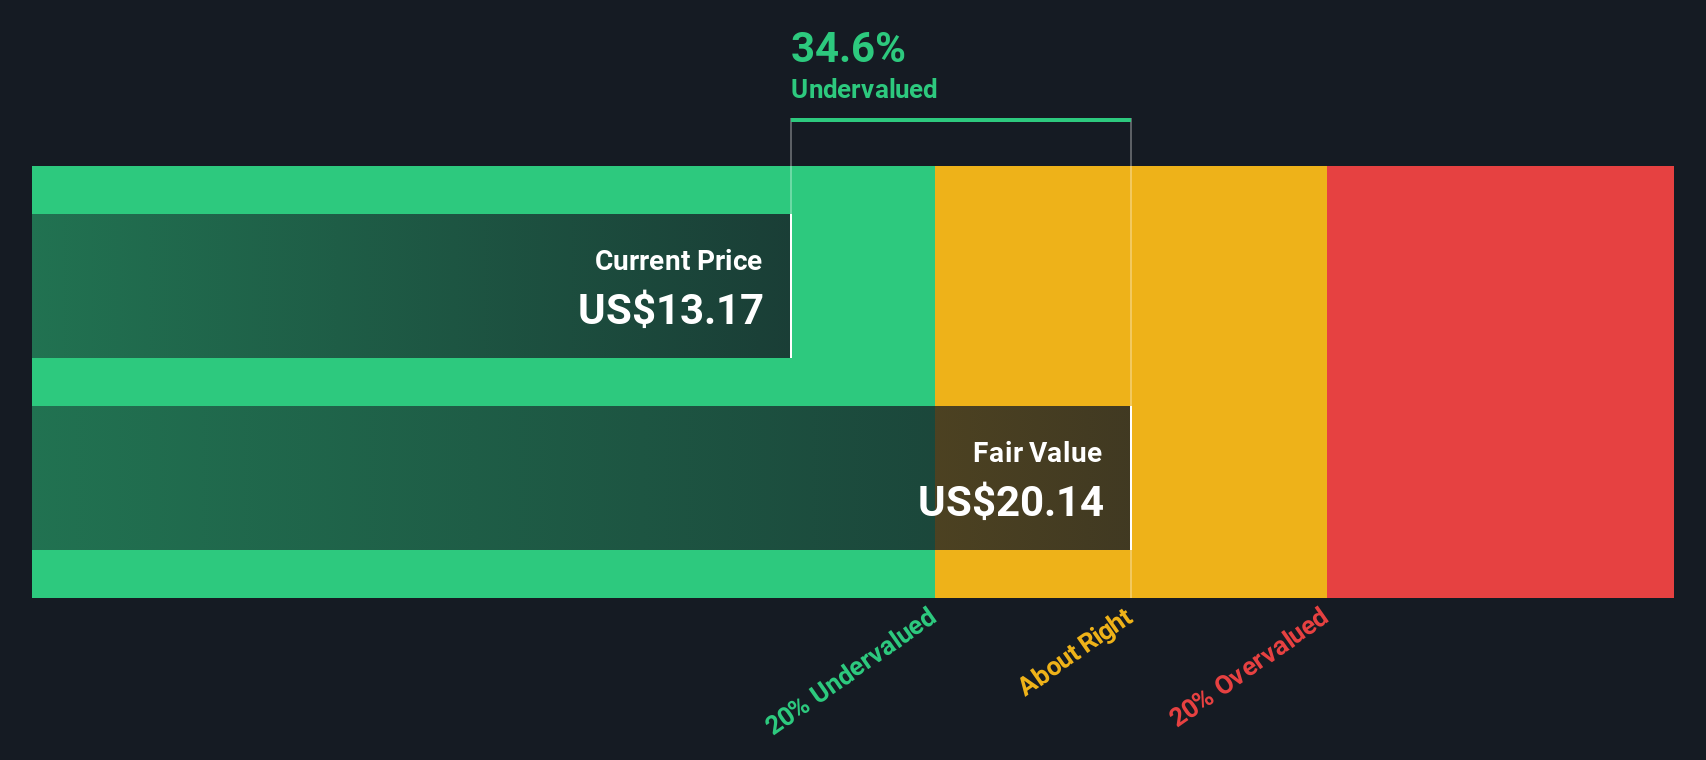
Pulling these discounted projections together produces an estimated intrinsic value of US$25.26 per share. Compared with the recent share price of US$18.65, the DCF output suggests MaxLinear trades at a 26.2% discount, which in this model indicates that the shares appear undervalued.
Result: UNDERVALUED
Our Discounted Cash Flow (DCF) analysis suggests MaxLinear is undervalued by 26.2%. Track this in your watchlist or portfolio, or discover 882 more undervalued stocks based on cash flows.
Approach 2: MaxLinear Price vs Sales
For companies where earnings are uneven or negative, the P/S ratio is often a cleaner yardstick because it focuses on revenue rather than profit swings. Investors typically accept a higher or lower P/S based on what they expect for future growth and how risky the business looks. Higher growth and lower perceived risk can justify a higher multiple, while slower growth or higher risk usually points to a lower one.
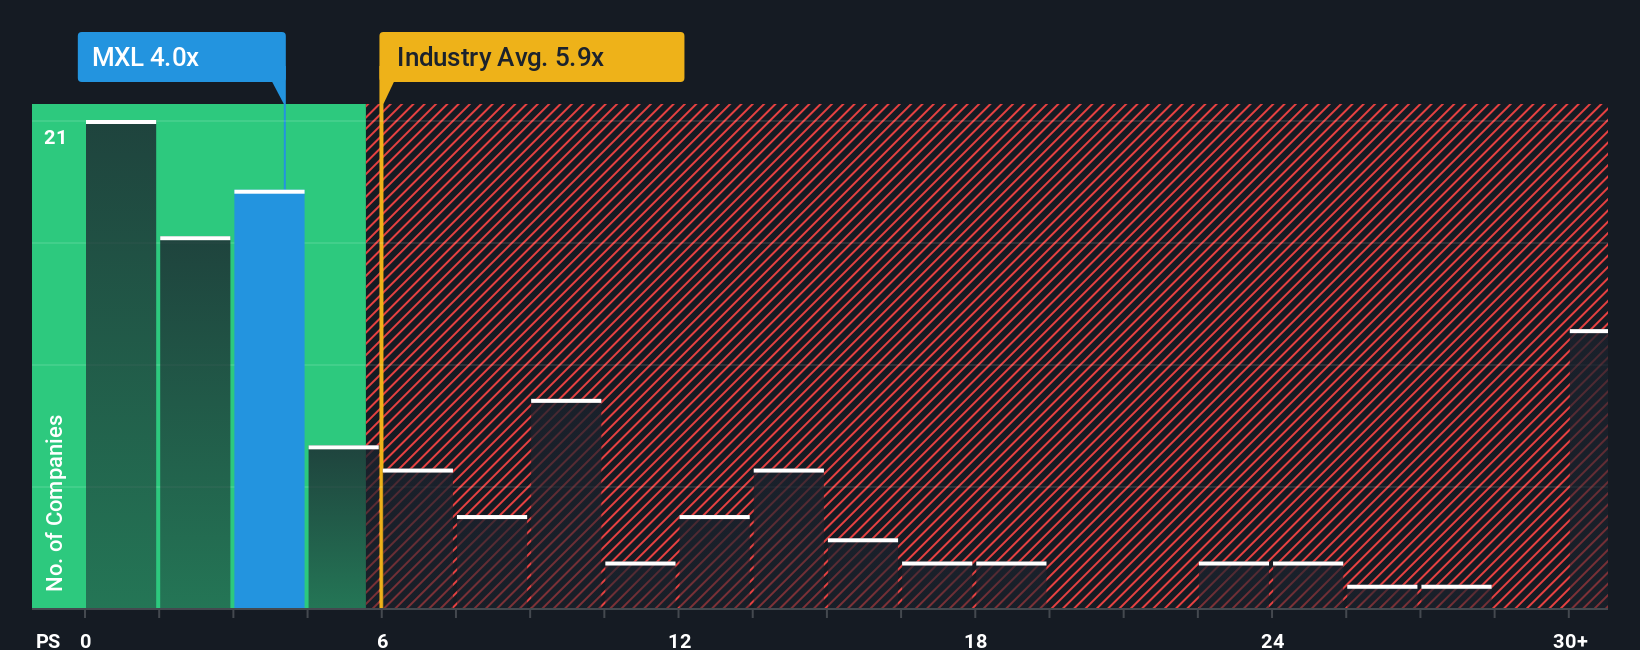
MaxLinear currently trades on a P/S of 3.85x. That sits below the Semiconductor industry average of 5.16x and above the peer group average of 2.17x, so the simple comparisons send a mixed signal. To cut through that, Simply Wall St uses a “Fair Ratio”, which estimates what P/S might be reasonable after factoring in earnings growth, profit margins, industry, market cap and specific risks. For MaxLinear, this Fair Ratio is 5.33x.
Because the Fair Ratio is higher than the current 3.85x, this framework suggests the shares trade below what the model considers a fair sales multiple.
Result: UNDERVALUED
P/S ratios tell one story, but what if the real opportunity lies elsewhere? Discover 1446 companies where insiders are betting big on explosive growth.
Upgrade Your Decision Making: Choose your MaxLinear Narrative
Earlier we mentioned that there is an even better way to understand valuation. On Simply Wall St's Community page you can use Narratives, where you set out your story for MaxLinear by plugging in your own expectations for future revenue, earnings and margins. You can then link that story to a forecast and fair value, and compare that fair value to today’s price to decide whether the stock looks attractive to you. The model updates automatically as new news or earnings arrive. One investor might build a bullish MaxLinear Narrative closer to the US$27.50 analyst target, while another might prefer a cautious Narrative nearer US$15.00, and both can see in clear numbers how their assumptions translate into a fair value estimate.
Do you think there's more to the story for MaxLinear? Head over to our Community to see what others are saying!

This article by Simply Wall St is general in nature. We provide commentary based on historical data and analyst forecasts only using an unbiased methodology and our articles are not intended to be financial advice. It does not constitute a recommendation to buy or sell any stock, and does not take account of your objectives, or your financial situation. We aim to bring you long-term focused analysis driven by fundamental data. Note that our analysis may not factor in the latest price-sensitive company announcements or qualitative material. Simply Wall St has no position in any stocks mentioned.
Have feedback on this article? Concerned about the content? Get in touch with us directly. Alternatively, email editorial-team@simplywallst.com