
 Nasdaq
 华尔街日报
华尔街日报Is It Time To Reassess Cava Group (CAVA) After Its Recent Share Price Surge
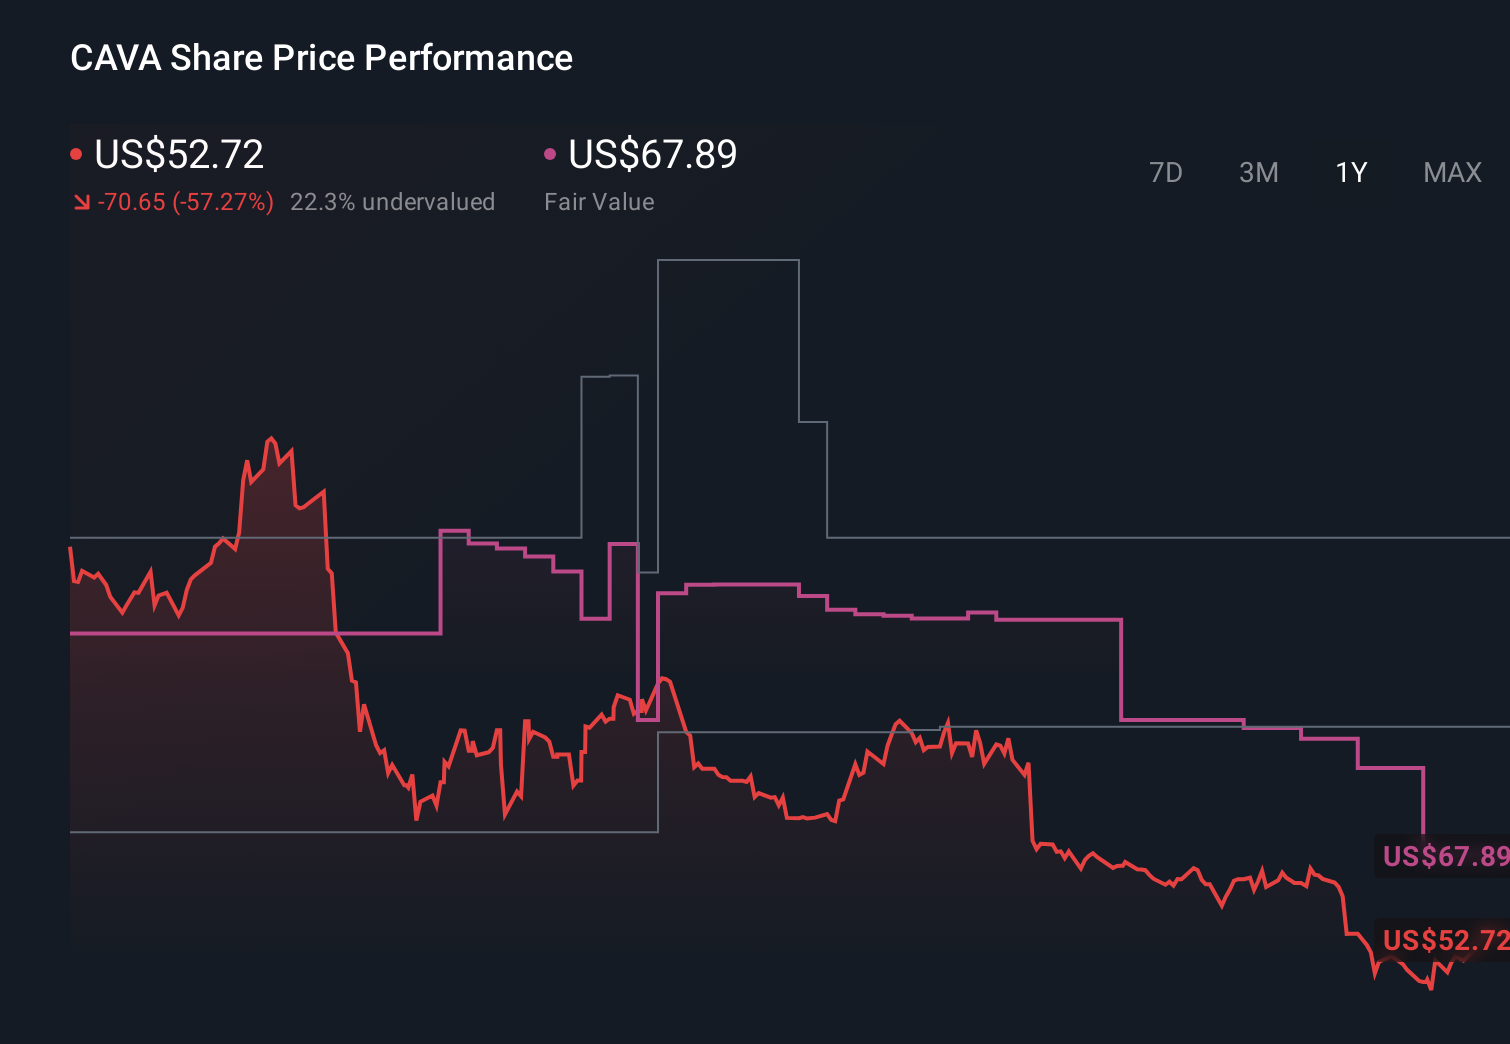
- Wondering if CAVA Group at around US$67.90 is a bargain, a bubble, or somewhere in between? This article walks through what the current price may be implying about the stock.
- The share price has moved sharply in the short term, with a 15.7% return over the last week and 26.1% over the last month, while the 1 year return sits at a 40.7% decline.
- Recent coverage around CAVA Group has focused on its position as a fast casual Mediterranean brand and its profile as a relatively new public company. This helps explain why the stock has attracted fresh attention. Commentary has often linked the recent price swings to shifting expectations about how quickly the business model might scale and how that growth could be valued.
- Simply Wall St currently assigns CAVA Group a valuation score of 0/6, which means it is not assessed as undervalued on any of the six checks used in that framework. Next, we will look at what different valuation approaches say about the stock and then finish with a method that can help you put all of those numbers in context.
CAVA Group scores just 0/6 on our valuation checks. See what other red flags we found in the full valuation breakdown.
Approach 1: CAVA Group Discounted Cash Flow (DCF) Analysis
A Discounted Cash Flow, or DCF, model estimates what a business might be worth today by projecting future cash flows and discounting them back to a present value using a required rate of return.
For CAVA Group, the model used is a 2 Stage Free Cash Flow to Equity approach. The company’s last twelve month free cash flow is about $8.10 million. Analyst and model projections then step this up over time, with free cash flow estimates reaching $248.51 million in 2030, with values between those years based on analyst inputs for the nearer term and Simply Wall St extrapolations further out.
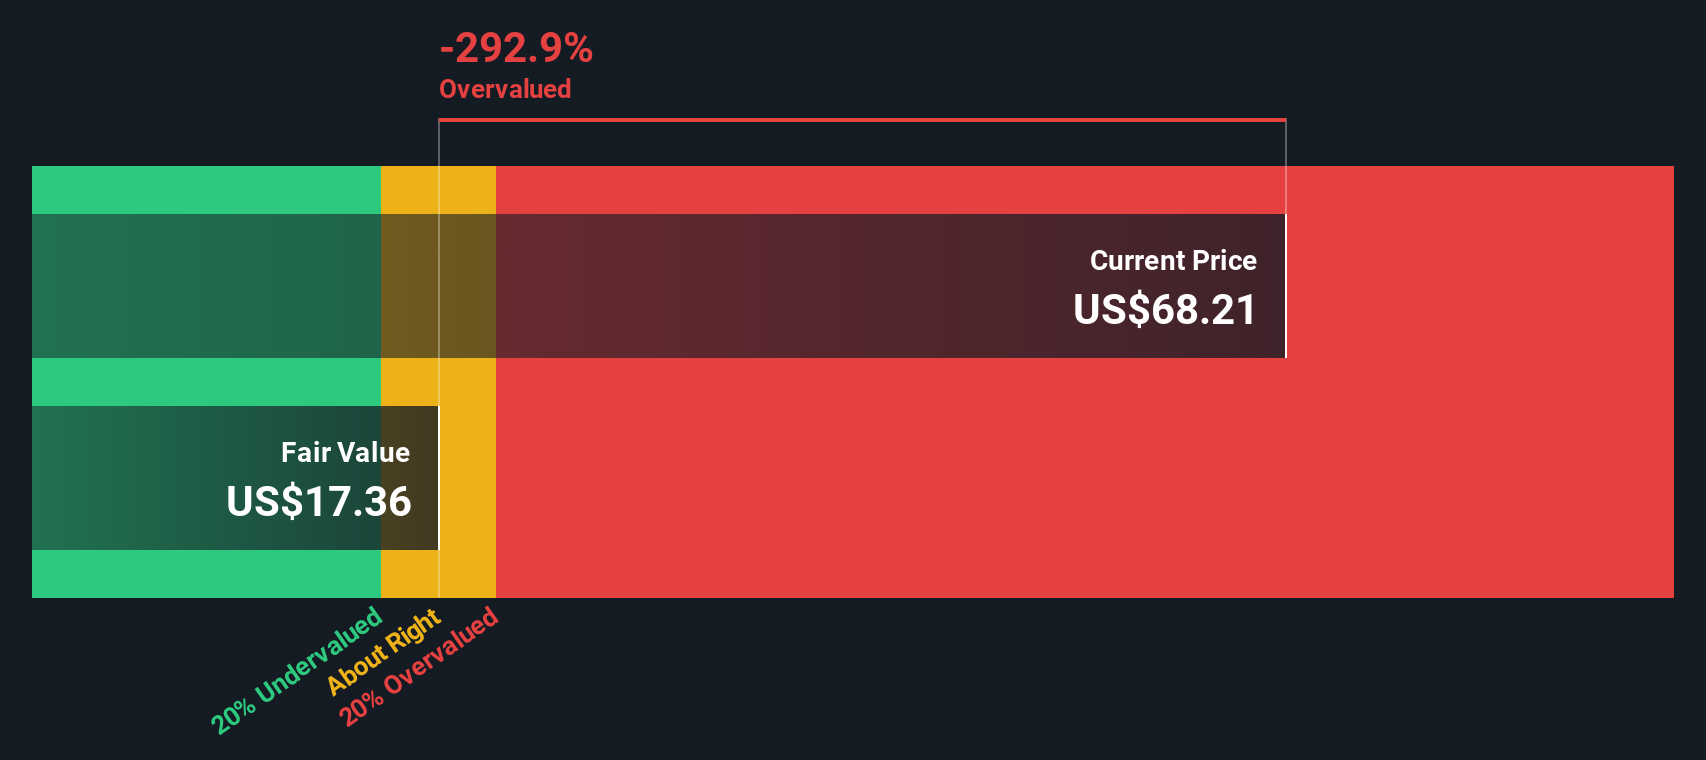
When all projected cash flows are discounted back and added together, the model arrives at an estimated intrinsic value of about $51.85 per share. Compared with the recent share price around $67.90, the DCF output suggests the stock is about 30.9% above this intrinsic value estimate. On this method alone, CAVA Group screens as overvalued.
Result: OVERVALUED
Our Discounted Cash Flow (DCF) analysis suggests CAVA Group may be overvalued by 30.9%. Discover 879 undervalued stocks or create your own screener to find better value opportunities.
Approach 2: CAVA Group Price vs Earnings
For profitable companies, the P/E ratio is a useful way to see how much you are paying for each dollar of earnings. It links directly to what matters most over time, which is how much profit the business generates for shareholders.
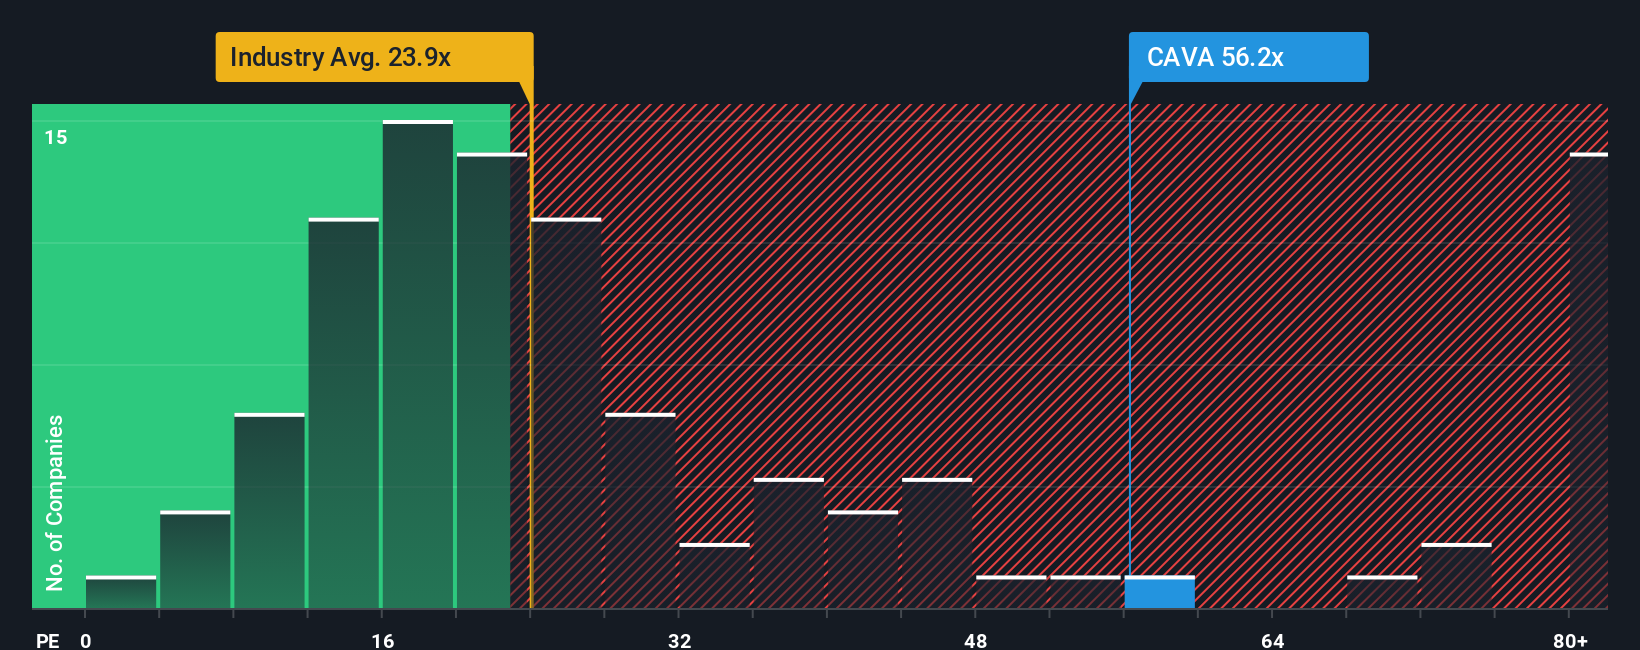
Higher growth expectations or lower perceived risk generally justify a higher “normal” or “fair” P/E, while slower expected growth or higher risk usually point to a lower one. With that in mind, CAVA Group currently trades on a P/E of about 57.3x. That sits above the Hospitality industry average of about 22.8x and also above the peer average of roughly 53.4x, so the stock is priced at a richer multiple than these broad benchmarks.
Simply Wall St’s Fair Ratio for CAVA Group is 20.5x. This is a proprietary estimate of what the P/E might be given the company’s earnings profile, industry, profit margins, market cap and risk factors. Because it adjusts for these fundamentals, the Fair Ratio can be more tailored than a simple comparison with peers or the sector. Set against the current P/E of 57.3x, the Fair Ratio suggests the shares are trading well above that tailored benchmark.
Result: OVERVALUED
P/E ratios tell one story, but what if the real opportunity lies elsewhere? Discover 1444 companies where insiders are betting big on explosive growth.
Upgrade Your Decision Making: Choose your CAVA Group Narrative
Earlier we mentioned that there is an even better way to understand valuation. On Simply Wall St you can use Narratives, where you spell out your story for CAVA Group, link that story to your own revenue, earnings and margin assumptions, translate those into a Fair Value, then see on the Community page how your view compares with others. For example, one investor might use the higher analyst price target of US$125.00 because they focus on expansion to 1,000 restaurants and strong appeal with younger consumers. Another might lean closer to the lower target of US$72.00 because they are more focused on risks like softer same-restaurant sales and competition. As new news or earnings arrive, the platform refreshes these Narratives so you can quickly compare your Fair Value to the current share price and decide whether you see the stock as closer to an opportunity or as fully priced.
Do you think there's more to the story for CAVA Group? Head over to our Community to see what others are saying!
This article by Simply Wall St is general in nature. We provide commentary based on historical data and analyst forecasts only using an unbiased methodology and our articles are not intended to be financial advice. It does not constitute a recommendation to buy or sell any stock, and does not take account of your objectives, or your financial situation. We aim to bring you long-term focused analysis driven by fundamental data. Note that our analysis may not factor in the latest price-sensitive company announcements or qualitative material. Simply Wall St has no position in any stocks mentioned.
Have feedback on this article? Concerned about the content? Get in touch with us directly. Alternatively, email editorial-team@simplywallst.com