
 Nasdaq
 华尔街日报
华尔街日报Is It Time To Reassess Charles Schwab (SCHW) After A 41% One-Year Rally
- If you are wondering whether Charles Schwab's current share price offers good value or is already pricing in a lot of optimism, this article will walk through the key signals you can use to frame that decision.
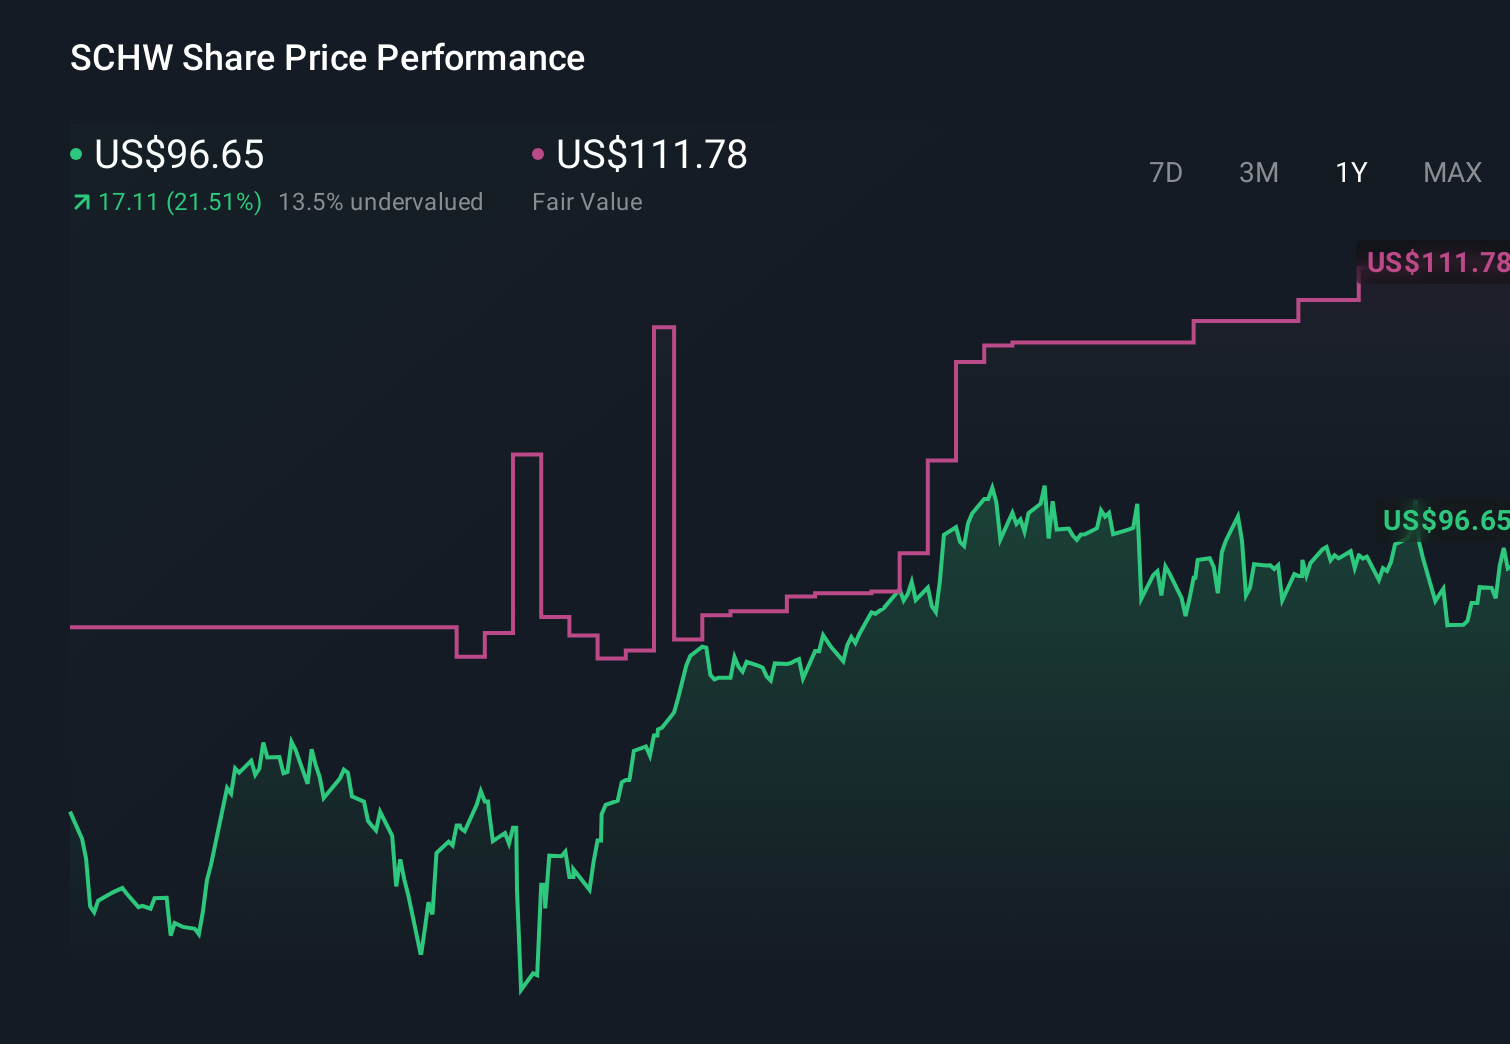
- With the stock last closing at US$101.93 and returns of 2.0% over 7 days, 8.1% over 30 days, 0.4% year to date, 41.3% over 1 year, 27.6% over 3 years, and 82.8% over 5 years, many investors are asking how much of this performance is already reflected in today's price.
- Recent coverage has focused on Charles Schwab's role as a large US brokerage and wealth management platform, as well as ongoing industry attention on trading activity, interest rate sensitivity, and client asset flows. These themes help explain why sentiment around the stock has been active and give important context when thinking about what investors are currently willing to pay.
- On Simply Wall St's six point valuation checklist, Charles Schwab scores 3 out of 6. This suggests that some valuation tests flag the stock as potentially undervalued while others are more cautious. Next, we will look at how different valuation approaches arrive at that view, before finishing with a broader way to frame value that goes beyond just the numbers.
Approach 1: Charles Schwab Excess Returns Analysis
The Excess Returns model looks at how much profit a company is expected to earn above the return that shareholders require, then ties that back to what the stock might be worth today.
For Charles Schwab, the model uses a Book Value of $23.85 per share and a Stable EPS of $6.88 per share, based on weighted future Return on Equity estimates from 7 analysts. The Average Return on Equity used in the model is 20.76%, compared with a Cost of Equity of $2.90 per share. That gap produces an Excess Return of $3.97 per share, which is the core driver of value in this framework.
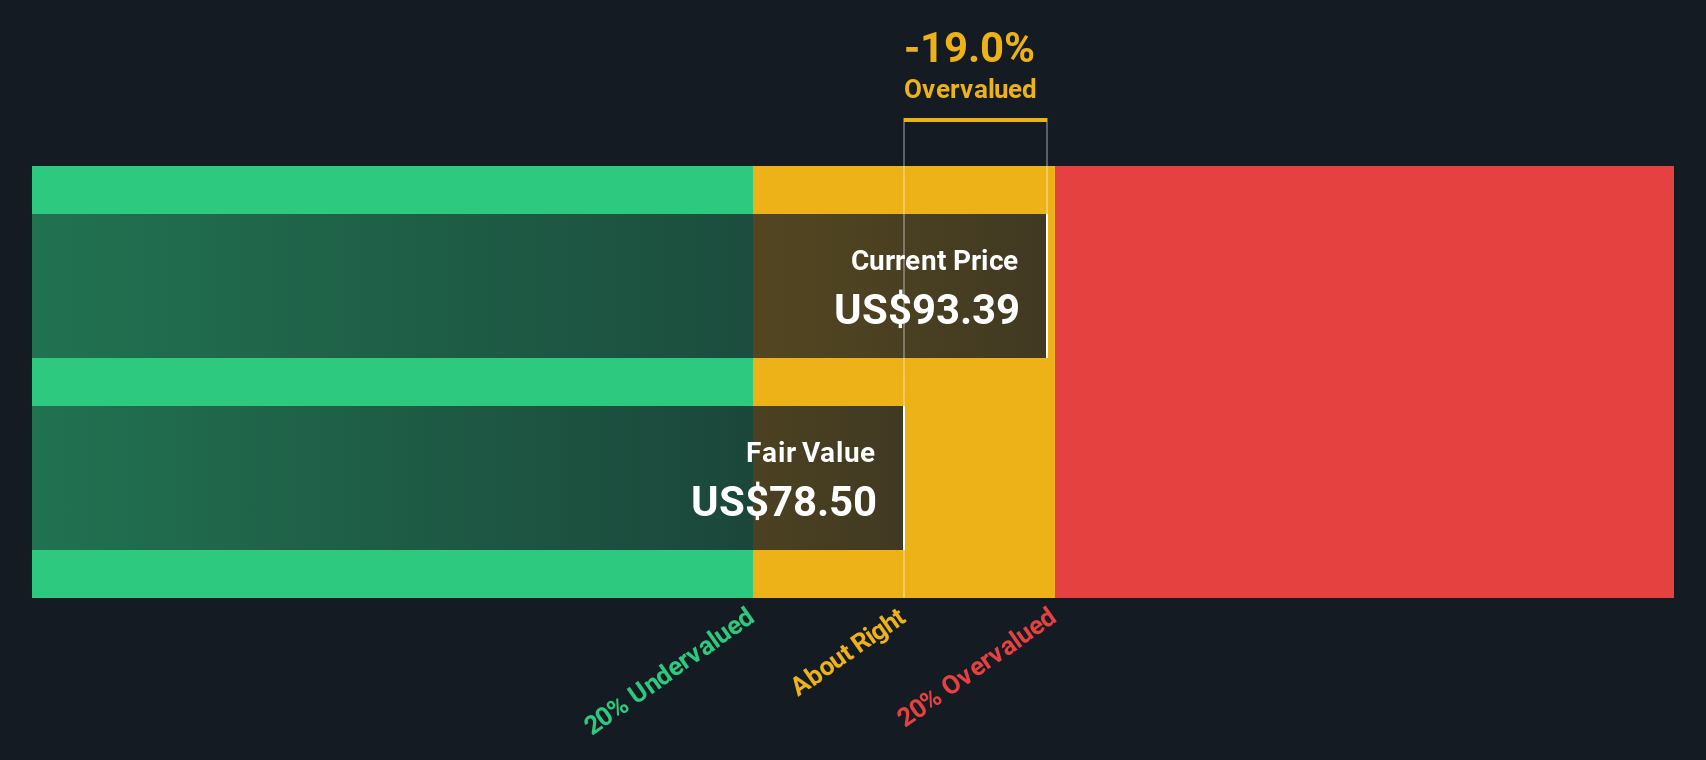
The analysis also assumes a Stable Book Value of $33.12 per share, sourced from weighted future Book Value estimates from 6 analysts. Putting these inputs together, the Excess Returns model arrives at an estimated intrinsic value of about $105.28 per share. With the current share price at US$101.93, this implies the stock is roughly 3.2% undervalued, which is a small difference.
Result: ABOUT RIGHT
Charles Schwab is fairly valued according to our Excess Returns, but this can change at a moment's notice. Track the value in your watchlist or portfolio and be alerted on when to act.
Approach 2: Charles Schwab Price vs Earnings
For a profitable company like Charles Schwab, the P/E ratio is a useful shorthand for how much investors are paying for each dollar of earnings. It ties the current share price directly to the business’s ability to generate profit today.
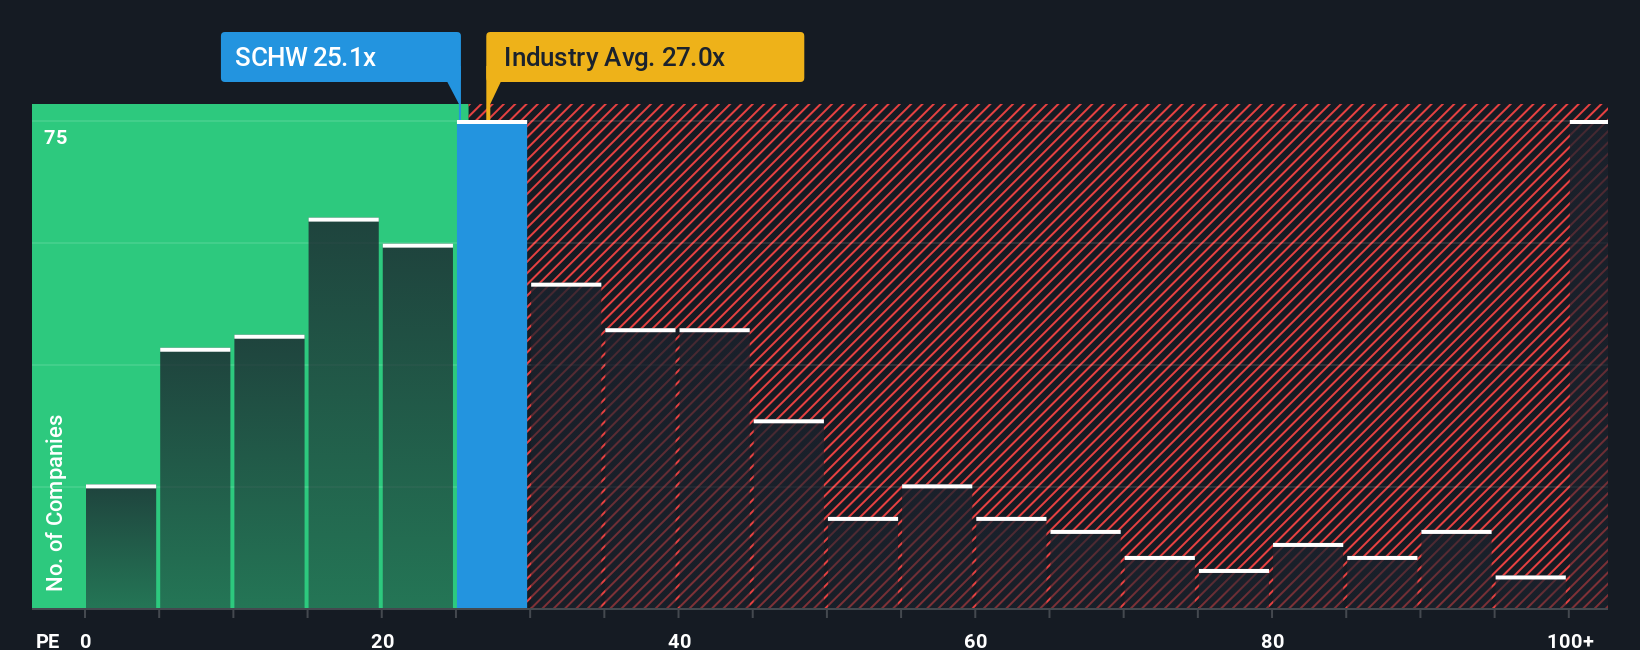
What counts as a “normal” P/E depends on how investors view growth potential and risk. Higher expected growth or lower perceived risk can justify a higher multiple, while slower growth or higher risk often lead to a lower one. Charles Schwab currently trades on a P/E of 23.3x. That sits below the Capital Markets industry average of 25.8x and the peer group average of 30.0x, so the stock is priced at a discount to those simple benchmarks.
Simply Wall St’s Fair Ratio offers a more tailored view. It suggests a P/E of 19.2x for Charles Schwab, based on factors such as earnings growth, industry, profit margins, market cap and risk profile. Because it adjusts for these company specific drivers, the Fair Ratio can be more informative than a blunt comparison with peers or the wider industry. Compared with this Fair Ratio, the current 23.3x multiple is higher, which indicates that the stock may be somewhat overvalued on this metric.
Result: OVERVALUED
P/E ratios tell one story, but what if the real opportunity lies elsewhere? Discover 1443 companies where insiders are betting big on explosive growth.
Upgrade Your Decision Making: Choose your Charles Schwab Narrative
Earlier we mentioned that there is an even better way to understand valuation. On Simply Wall St you can use Narratives, where you tell the story you believe about Charles Schwab, link it to your own revenue, earnings and margin assumptions, and see a Fair Value that updates as new information like earnings or news arrives. You can then compare that Fair Value to today’s price to help inform your decision, much like how one investor might align with a higher Fair Value around US$131.00 while another leans toward a more cautious view closer to US$84.00, all within the Community page used by millions of investors.
Do you think there's more to the story for Charles Schwab? Head over to our Community to see what others are saying!
This article by Simply Wall St is general in nature. We provide commentary based on historical data and analyst forecasts only using an unbiased methodology and our articles are not intended to be financial advice. It does not constitute a recommendation to buy or sell any stock, and does not take account of your objectives, or your financial situation. We aim to bring you long-term focused analysis driven by fundamental data. Note that our analysis may not factor in the latest price-sensitive company announcements or qualitative material. Simply Wall St has no position in any stocks mentioned.
Have feedback on this article? Concerned about the content? Get in touch with us directly. Alternatively, email editorial-team@simplywallst.com