
 Nasdaq
 华尔街日报
华尔街日报Is Phillips 66 (PSX) Still Attractive After Its Recent Share Price Rally?
- If you are looking at Phillips 66 and wondering whether the current share price still offers value, this article will walk through what the numbers actually say.
- The stock last closed at US$137.88, with returns of 6.9% over 7 days, a 0.8% decline over 30 days, 5.6% year to date, 23.1% over 1 year, 51.5% over 3 years, and 133.6% over 5 years.
- Recent market attention around Phillips 66 has focused on its position in the US energy sector and how investors are weighing refiner exposure against broader macro and commodity trends. That context helps explain why the share price has seen both short term strength and some near term pullback as expectations and risk appetite shift.
- On our framework, Phillips 66 currently has a valuation score of 2 out of 6. This means it screens as undervalued on 2 of the 6 checks we use. We will walk through those methods next and then finish with one more way to look at value that can give an even fuller picture.
Phillips 66 scores just 2/6 on our valuation checks. See what other red flags we found in the full valuation breakdown.
Approach 1: Phillips 66 Discounted Cash Flow (DCF) Analysis
A Discounted Cash Flow, or DCF, model takes the cash Phillips 66 is expected to generate in the future, then discounts those amounts back to today to estimate what the entire business could be worth right now.
For Phillips 66, the latest twelve month free cash flow is about US$1.48b. Using a 2 Stage Free Cash Flow to Equity model, analysts have explicit projections out to 2027, with free cash flow expected to be US$5.43b in that year. Beyond that, Simply Wall St extrapolates cash flows further, with ten year projections that step up from around US$4.77b in 2026 to about US$8.41b by 2035, each of which is discounted back to today.
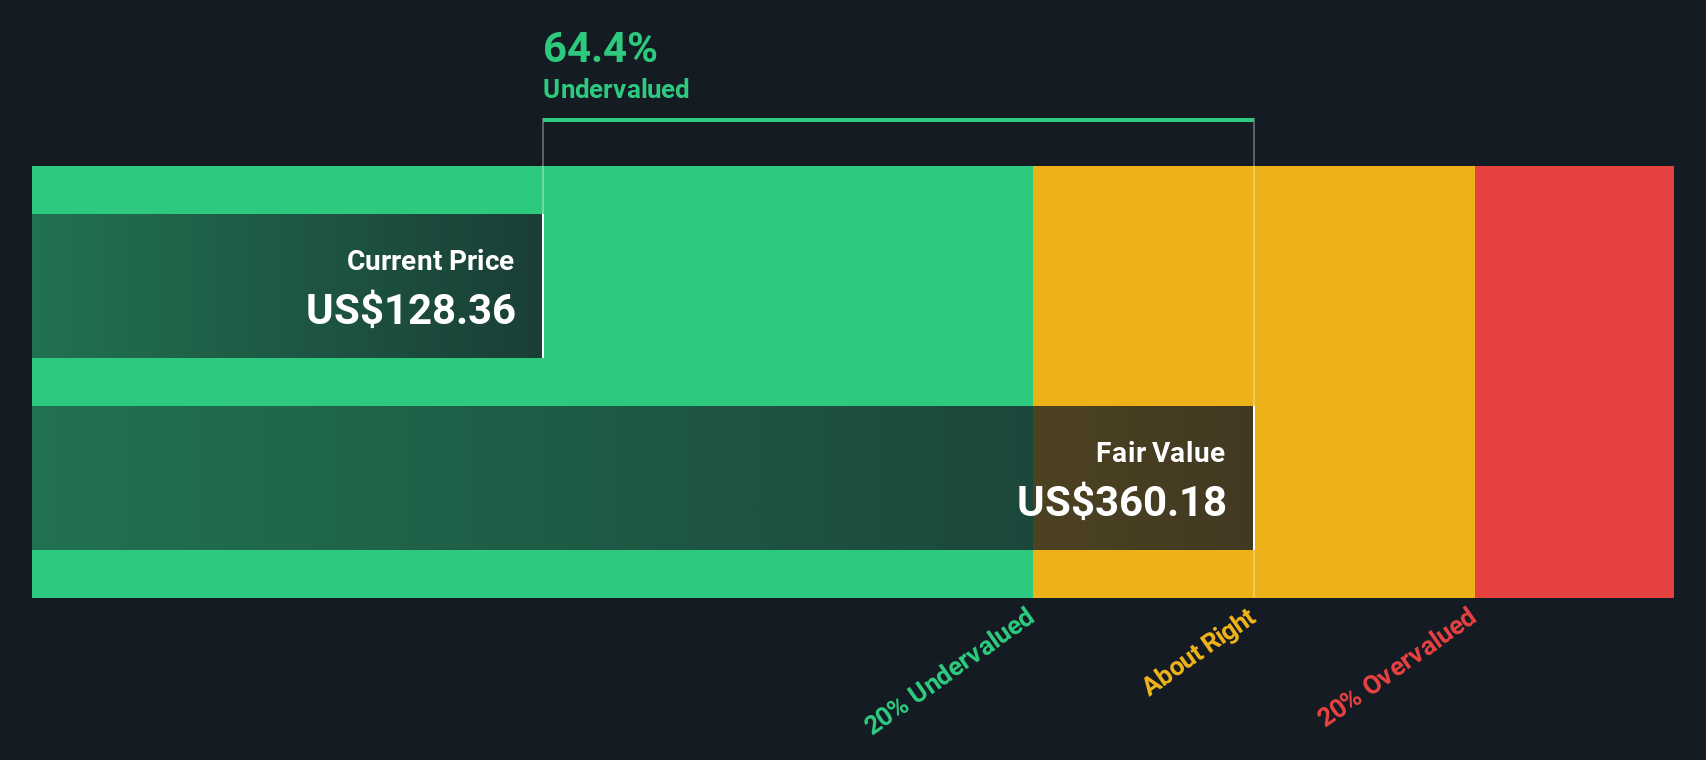
When all those projected and discounted cash flows are added together, the model arrives at an estimated intrinsic value of roughly US$412.87 per share for Phillips 66. Compared with the recent share price of US$137.88, the DCF output suggests the stock trades at a 66.6% discount, which screens as materially undervalued on this framework.
Result: UNDERVALUED
Our Discounted Cash Flow (DCF) analysis suggests Phillips 66 is undervalued by 66.6%. Track this in your watchlist or portfolio, or discover 884 more undervalued stocks based on cash flows.
Approach 2: Phillips 66 Price vs Earnings
For a profitable company, the P/E ratio is a useful way to see how much you are paying for each dollar of current earnings. It reflects what the market is willing to pay today for the earnings the business is already generating, which makes it a straightforward cross check against the DCF output.
What counts as a “normal” P/E depends on how investors see the company’s growth prospects and risk. Higher expected growth or lower perceived risk can support a higher multiple, while slower growth or higher risk usually point to a lower one.
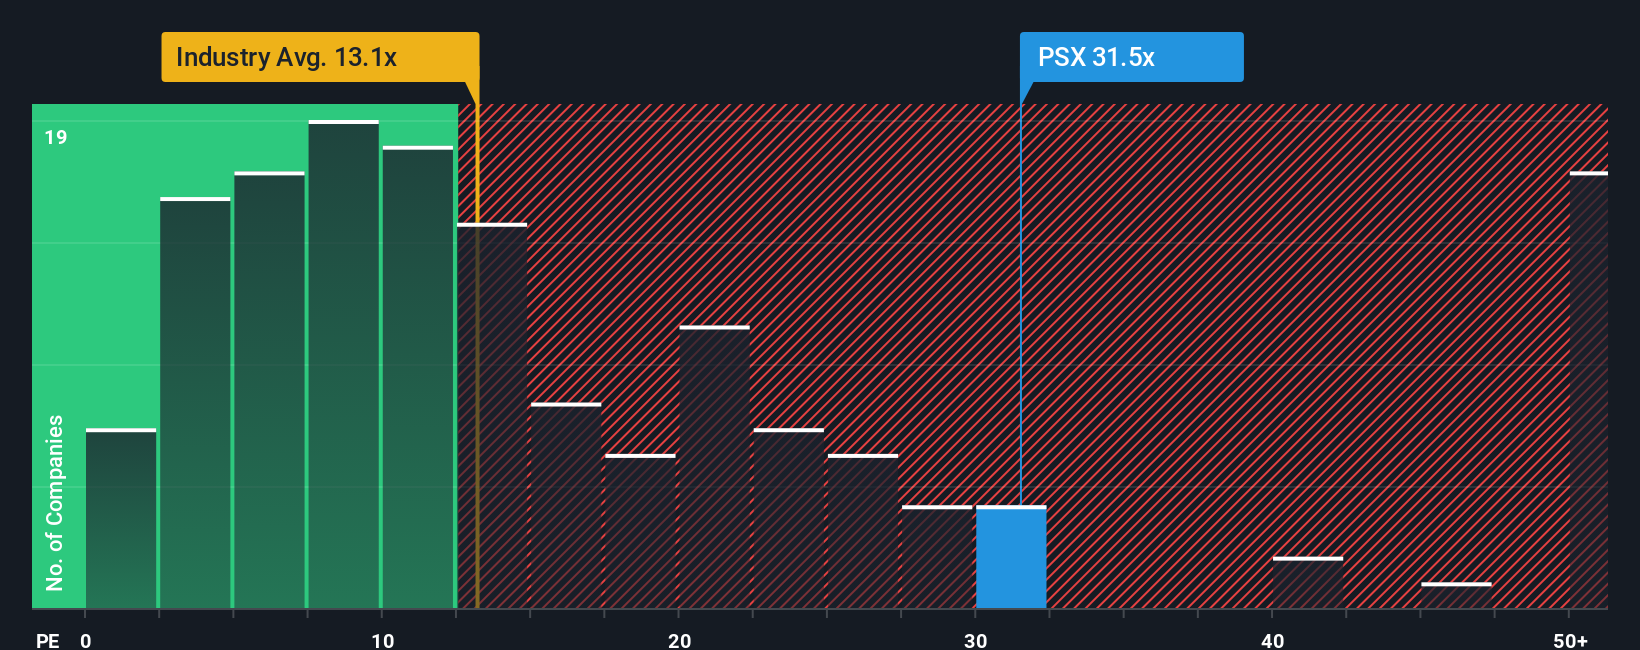
Phillips 66 currently trades on a P/E of 37.11x. That sits above the Oil and Gas industry average of 13.03x and also above the peer average of 25.87x. Simply Wall St’s Fair Ratio for Phillips 66 is 23.61x, which is a proprietary estimate of the P/E you might expect given factors such as its earnings growth profile, industry, profit margins, market cap and risk characteristics.
This Fair Ratio is more tailored than a simple peer or industry comparison because it adjusts for those company specific inputs rather than assuming one size fits all. Set against the actual P/E of 37.11x, the Fair Ratio points to Phillips 66 screening as overvalued on this metric.
Result: OVERVALUED
P/E ratios tell one story, but what if the real opportunity lies elsewhere? Discover 1444 companies where insiders are betting big on explosive growth.
Upgrade Your Decision Making: Choose your Phillips 66 Narrative
Earlier we mentioned that there is an even better way to understand valuation, so let us introduce you to Narratives. These are simple stories you build around a company that connect your view of its future revenue, earnings and margins to a financial forecast and then to a fair value. On Simply Wall St’s Community page you can see this in action for Phillips 66. One Narrative with a fair value of about US$268.71 might come from someone who thinks the company has room for higher margins through operational efficiency and growth projects. Another Narrative with a fair value around US$148.85 reflects a more cautious stance on revenue trends and discount rates. By comparing each Narrative’s Fair Value with the current price, you can quickly see whether that particular story suggests opportunity or risk, with the numbers and valuation updating as new news, earnings or company developments are incorporated.
Do you think there's more to the story for Phillips 66? Head over to our Community to see what others are saying!

This article by Simply Wall St is general in nature. We provide commentary based on historical data and analyst forecasts only using an unbiased methodology and our articles are not intended to be financial advice. It does not constitute a recommendation to buy or sell any stock, and does not take account of your objectives, or your financial situation. We aim to bring you long-term focused analysis driven by fundamental data. Note that our analysis may not factor in the latest price-sensitive company announcements or qualitative material. Simply Wall St has no position in any stocks mentioned.
Have feedback on this article? Concerned about the content? Get in touch with us directly. Alternatively, email editorial-team@simplywallst.com