
 Nasdaq
 华尔街日报
华尔街日报Assessing ASICS (TSE:7936) Valuation After Strong One Year Shareholder Returns
ASICS share performance snapshot for retail investors
ASICS (TSE:7936) has drawn attention after a recent stretch of positive returns, with the stock up 0.2% over the past day, 6.4% over the week, and about 8.7% over the past month.
See our latest analysis for ASICS.
Looking beyond the recent bounce, ASICS has a 1 year total shareholder return of 23.8% and a very large 5 year total shareholder return. This suggests momentum has been building as investors reassess both growth potential and risks around the current ¥3,996 share price.
If ASICS has you looking more closely at consumer names, it could be a good moment to broaden your watchlist with auto manufacturers as another area to research for ideas.
So with a 1 year total return of 23.8% and a share price around ¥3,996, is ASICS still trading below what its fundamentals suggest, or is the market already pricing in most of the expected growth?
Price to earnings of 33.2x: Is it justified?
ASICS is trading on a P/E of 33.2x at a last close of ¥3,996, which screens as expensive compared with both its peers and the wider Japan luxury space.
The P/E ratio compares the share price to earnings per share and is a common way to see how much investors are paying for each unit of profit. For a branded consumer company like ASICS, a higher P/E can reflect expectations for future profit growth and the strength of its brand and margins rather than just current earnings alone.
Here, the current 33.2x P/E sits well above the estimated fair P/E of 24.4x. This suggests the market is paying a premium over what the SWS fair ratio points to as a level it could move toward, given ASICS' fundamentals and growth profile.
That premium is also clear against both comparison points. ASICS is valued more richly than the peer average P/E of 14.4x and the Japan luxury industry average P/E of 15.6x, which signals investors are placing a much higher earnings multiple on the stock than is typical across its sector.
Explore the SWS fair ratio for ASICS
Result: Price-to-earnings of 33.2x (OVERVALUED)
However, you also need to weigh risks, such as any slowdown in annual revenue or net income growth, or a reassessment of that 33.2x P/E premium.
Find out about the key risks to this ASICS narrative.
Another view: what does the DCF say?
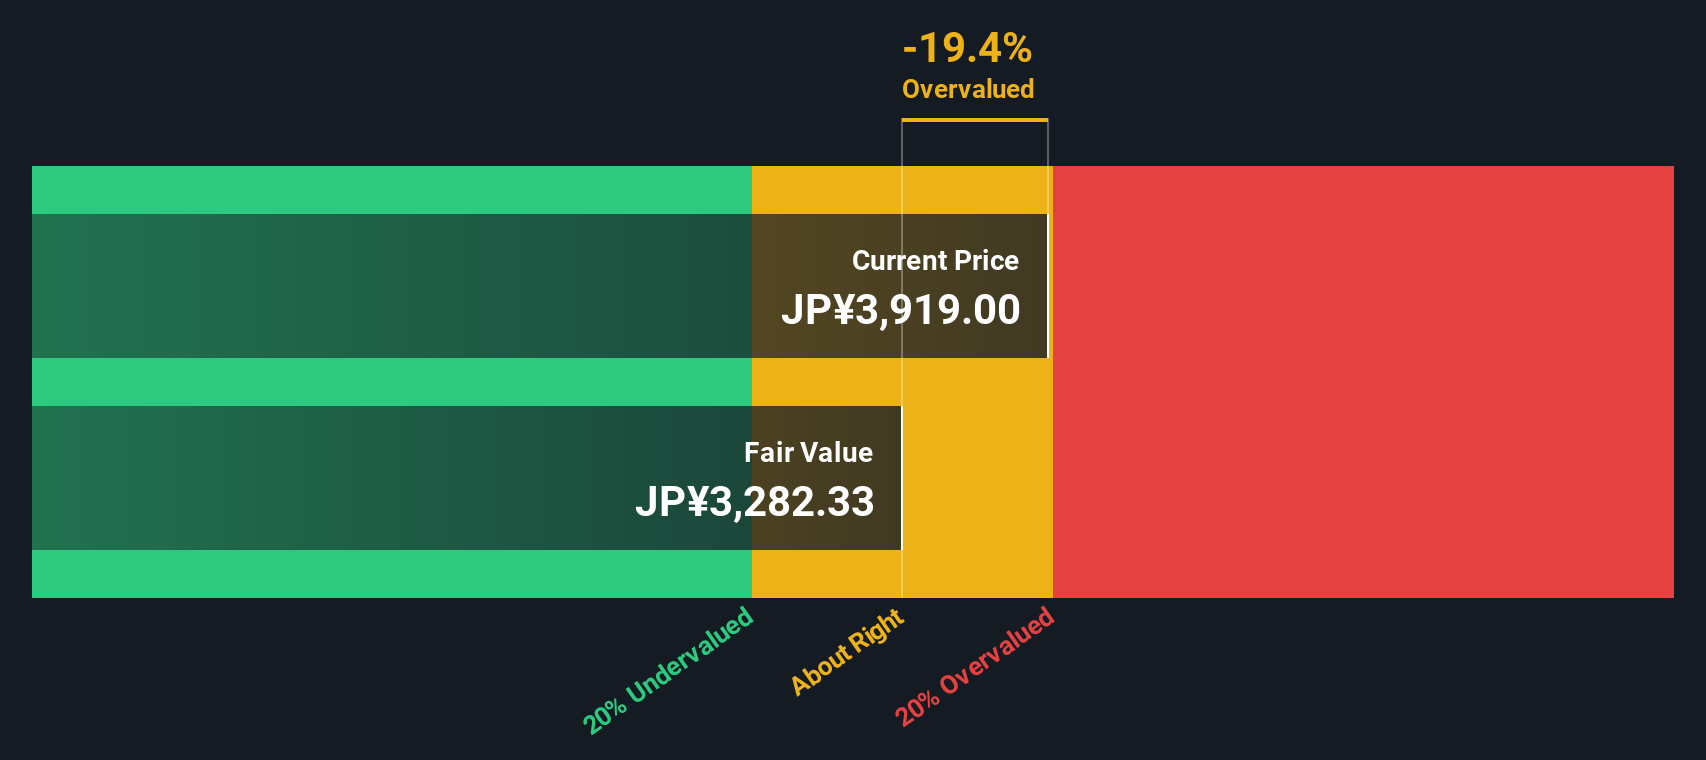
While the P/E of 33.2x suggests ASICS is priced richly, our DCF model points to a fair value of ¥3,221.69 per share. With the current price at ¥3,996, that implies the shares are trading above this estimate. This raises the question of how much optimism is already in the price.
Look into how the SWS DCF model arrives at its fair value.
Simply Wall St performs a discounted cash flow (DCF) on every stock in the world every day (check out ASICS for example). We show the entire calculation in full. You can track the result in your watchlist or portfolio and be alerted when this changes, or use our stock screener to discover 887 undervalued stocks based on their cash flows. If you save a screener we even alert you when new companies match - so you never miss a potential opportunity.
Build Your Own ASICS Narrative
If you see the numbers differently or simply like to dig into the data yourself, you can build a personalised ASICS view in just a few minutes, starting with Do it your way.
A good starting point is our analysis highlighting 2 key rewards investors are optimistic about regarding ASICS.
Ready to hunt for your next idea?
If ASICS is on your radar, do not stop there. Put a few minutes into fresh ideas and give yourself more options before the next move.
- Spot potential mispricings early by scanning these 887 undervalued stocks based on cash flows and seeing which companies line up with strong cash flow support.
- Explore major tech themes by checking these 26 AI penny stocks for companies connected to artificial intelligence.
- Look for income-focused opportunities through these 12 dividend stocks with yields > 3% and see which names currently offer yields above 3%.
This article by Simply Wall St is general in nature. We provide commentary based on historical data and analyst forecasts only using an unbiased methodology and our articles are not intended to be financial advice. It does not constitute a recommendation to buy or sell any stock, and does not take account of your objectives, or your financial situation. We aim to bring you long-term focused analysis driven by fundamental data. Note that our analysis may not factor in the latest price-sensitive company announcements or qualitative material. Simply Wall St has no position in any stocks mentioned.
Have feedback on this article? Concerned about the content? Get in touch with us directly. Alternatively, email editorial-team@simplywallst.com