
 Nasdaq
 华尔街日报
华尔街日报Grupo Empresarial San José And 2 Other Undiscovered Gems in Europe
As the pan-European STOXX Europe 600 Index reaches new heights, buoyed by an improving economic backdrop, investors are increasingly looking beyond the major indices to uncover potential opportunities within Europe's small-cap landscape. In this environment of robust market performance, identifying stocks with strong fundamentals and growth potential can be key to capitalizing on emerging trends.
Top 10 Undiscovered Gems With Strong Fundamentals In Europe
| Name | Debt To Equity | Revenue Growth | Earnings Growth | Health Rating |
|---|---|---|---|---|
| Caisse Régionale de Crédit Agricole Mutuel Brie Picardie Société coopérative | 37.61% | 3.36% | 6.34% | ★★★★★★ |
| Arendals Fossekompani | 26.72% | 2.84% | 7.78% | ★★★★★★ |
| Inmocemento | 28.68% | 4.15% | 33.84% | ★★★★★☆ |
| Freetrailer Group | 38.17% | 23.13% | 31.09% | ★★★★★☆ |
| Inversiones Doalca SOCIMI | 13.10% | 6.72% | 3.11% | ★★★★★☆ |
| Mangold Fondkommission | NA | -6.00% | -42.55% | ★★★★★☆ |
| ABG Sundal Collier Holding | 35.58% | -7.59% | -18.30% | ★★★★☆☆ |
| Darwin | 3.03% | 50.55% | 46377.71% | ★★★★☆☆ |
| Practic | NA | 4.86% | 6.64% | ★★★★☆☆ |
| Alantra Partners | 11.36% | -6.39% | -33.69% | ★★★★☆☆ |
Underneath we present a selection of stocks filtered out by our screen.
Grupo Empresarial San José (BME:GSJ)
Simply Wall St Value Rating: ★★★★★★
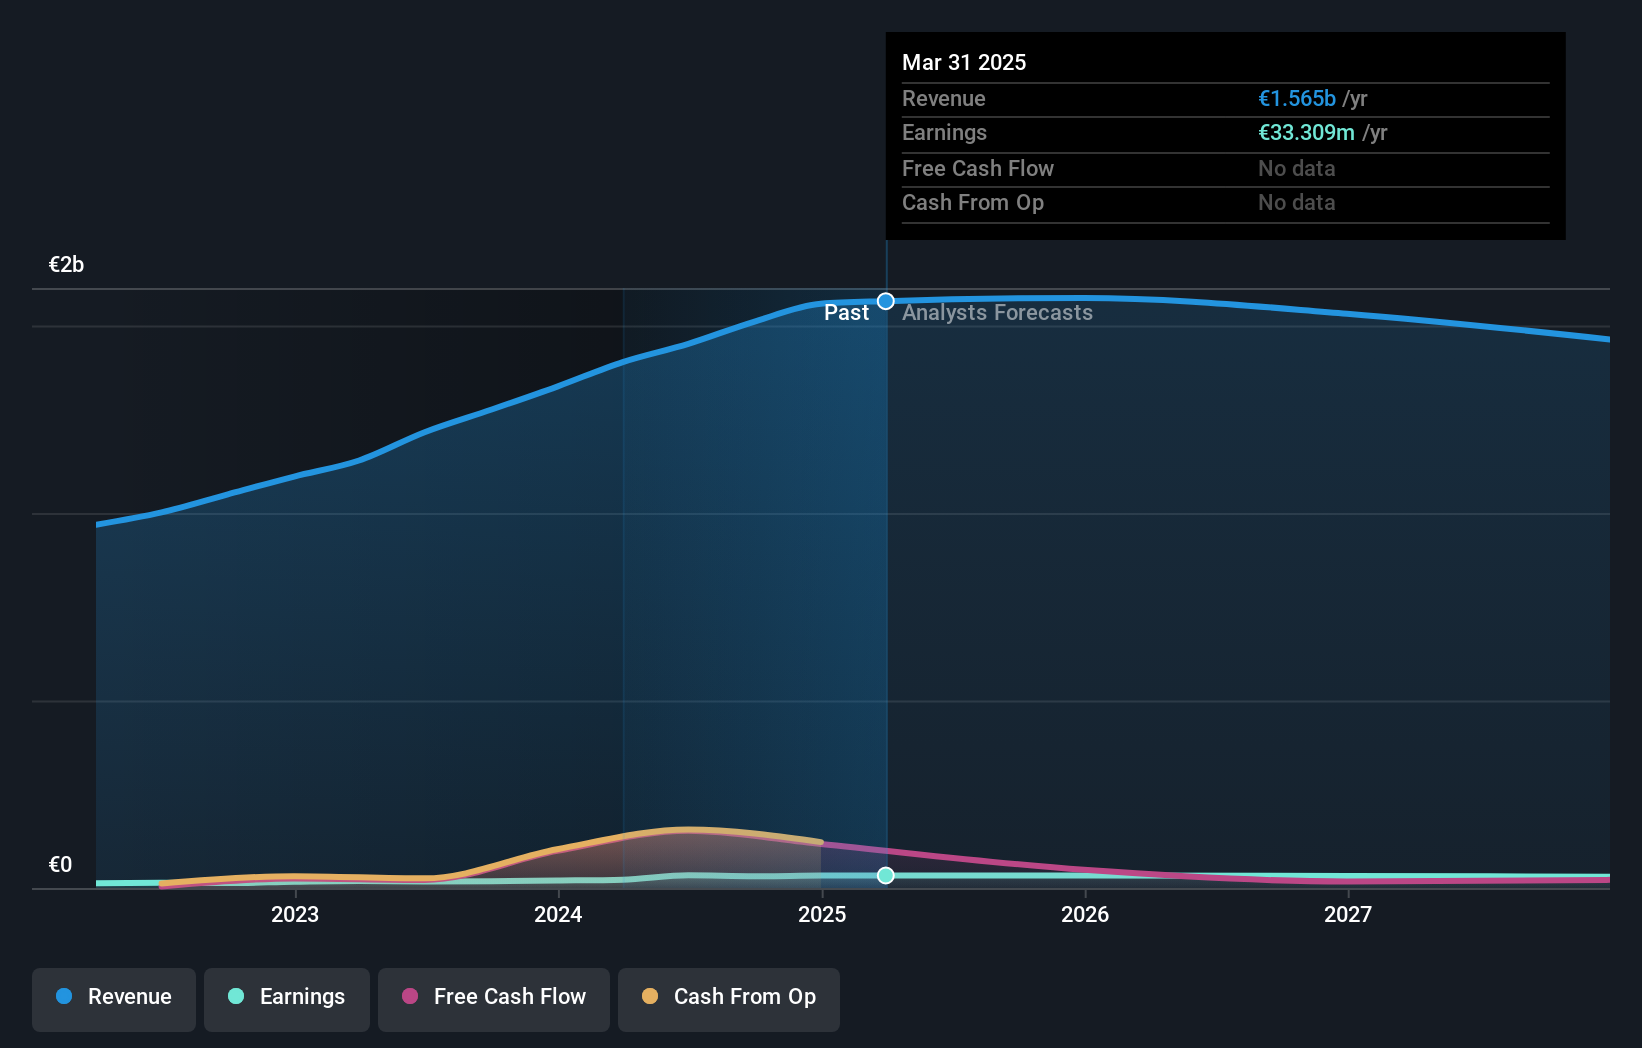
Overview: Grupo Empresarial San José, S.A., along with its subsidiaries, operates in the construction industry both in Spain and internationally, with a market capitalization of approximately €515.66 million.
Operations: San José generates revenue primarily from its construction segment, which accounts for approximately €1.43 billion, followed by concessions and services contributing €79.84 million. The energy sector adds €11.27 million, while real estate and urban development bring in €6.83 million.
Grupo Empresarial San José, a notable player in the construction sector, has demonstrated commendable financial health with its debt to equity ratio decreasing from 100% to 46.6% over five years. Its earnings surged by 19.6% last year, outpacing the industry average of 9.8%, and are projected to grow at an annual rate of 4.83%. The company boasts high-quality earnings and trades at a price-to-earnings ratio of 13.8x, which is favorable compared to the Spanish market's average of 17.3x. Recent reports show net income rising from €23.17 million to €27.59 million year-on-year for nine months ended September 2025, reflecting solid performance amidst stable sales figures around €1,148 million annually.
Nelly Group (OM:NELLY)
Simply Wall St Value Rating: ★★★★★★
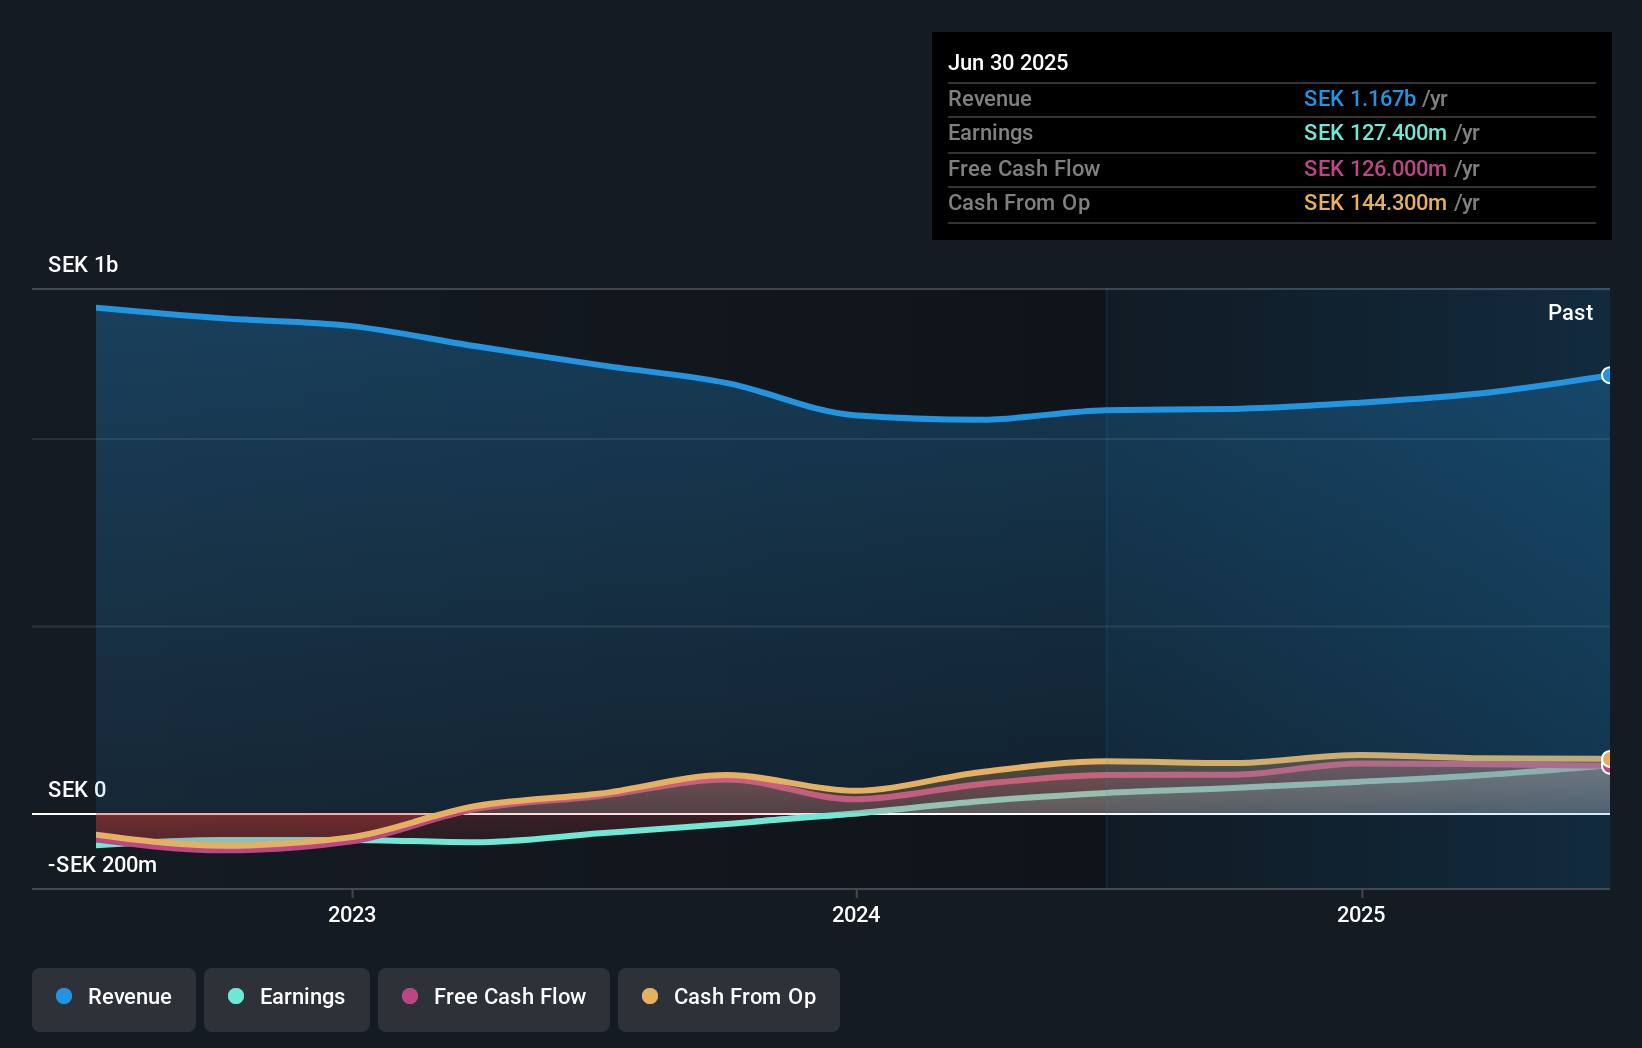
Overview: Nelly Group AB (publ) is a fashion company that operates in Sweden, the rest of the Nordics, and internationally, with a market capitalization of SEK3.53 billion.
Operations: The company generates revenue primarily through its Nelly segment, which reported SEK1.21 billion.
Nelly Group, a nimble player in the Nordic fashion scene, has been making waves with impressive financial strides. Over the past year, earnings surged by 120%, outpacing the industry average of 27%. Despite its removal from the OMX Nordic Small Cap Index recently, Nelly continues to thrive financially with a debt-free status and positive free cash flow. The collaboration with Qliro is expected to enhance customer experiences and boost margins through innovative strategies like Upsell and Gen 3 checkout. Recent third-quarter sales hit SEK 283.7 million, while net income rose to SEK 41.5 million from SEK 22.3 million last year.
- Click here and access our complete health analysis report to understand the dynamics of Nelly Group.
Evaluate Nelly Group's historical performance by accessing our past performance report.
XANO Industri (OM:XANO B)
Simply Wall St Value Rating: ★★★★★★
Overview: XANO Industri AB (publ) is a company that develops, manufactures, and sells industrial products and automation equipment across Sweden, the rest of the Nordic countries, Europe, and internationally with a market cap of SEK5.33 billion.
Operations: XANO Industri generates revenue primarily from three segments: Industrial Products (SEK892.13 million), Industrial Solutions (SEK2.04 billion), and Precision Technology (SEK487.89 million).
XANO Industri, a promising player in the machinery sector, has shown impressive financial agility. With a price-to-earnings ratio of 23.3x, it stands attractively below the industry average of 24.7x. Over five years, its debt to equity ratio improved from 70.5% to 55.6%, while maintaining satisfactory interest coverage at 3.9x EBIT over interest payments. Despite a challenging five-year earnings decline averaging 15.7% annually, recent performance shines with a remarkable earnings surge of 299% last year and net income climbing to SEK168 million for nine months ending September 2025 compared to SEK39 million previously, indicating robust recovery potential amidst industry challenges.
- Get an in-depth perspective on XANO Industri's performance by reading our health report here.
Understand XANO Industri's track record by examining our Past report.

Where To Now?
- Unlock more gems! Our European Undiscovered Gems With Strong Fundamentals screener has unearthed 294 more companies for you to explore.Click here to unveil our expertly curated list of 297 European Undiscovered Gems With Strong Fundamentals.
- Are you invested in these stocks already? Keep abreast of every twist and turn by setting up a portfolio with Simply Wall St, where we make it simple for investors like you to stay informed and proactive.
- Discover a world of investment opportunities with Simply Wall St's free app and access unparalleled stock analysis across all markets.
Seeking Other Investments?
- Explore high-performing small cap companies that haven't yet garnered significant analyst attention.
- Fuel your portfolio with companies showing strong growth potential, backed by optimistic outlooks both from analysts and management.
- Find companies with promising cash flow potential yet trading below their fair value.
This article by Simply Wall St is general in nature. We provide commentary based on historical data and analyst forecasts only using an unbiased methodology and our articles are not intended to be financial advice. It does not constitute a recommendation to buy or sell any stock, and does not take account of your objectives, or your financial situation. We aim to bring you long-term focused analysis driven by fundamental data. Note that our analysis may not factor in the latest price-sensitive company announcements or qualitative material. Simply Wall St has no position in any stocks mentioned.
Have feedback on this article? Concerned about the content? Get in touch with us directly. Alternatively, email editorial-team@simplywallst.com