
 Nasdaq
 华尔街日报
华尔街日报A Look At Kulicke And Soffa Industries (KLIC) Valuation After Recent Share Price Momentum
Assessing recent stock performance
Kulicke and Soffa Industries (KLIC) has drawn investor attention after a period of stronger recent returns, including gains over the past week, month, and past 3 months, alongside positive one year and multi year total returns.
See our latest analysis for Kulicke and Soffa Industries.
The recent 18.5% 7 day share price return and 32.07% 90 day share price return at a current share price of $53.99 sit alongside a 1 year total shareholder return of 15.98% and 5 year total shareholder return of 56.82%. This suggests momentum has been building over both short and longer horizons.
If this rebound in semiconductor equipment names has your attention, it could be a good moment to broaden your watchlist with high growth tech and AI stocks.
With KLIC trading at $53.99 versus an analyst price target of $48.75 and an intrinsic value estimate that is slightly lower than today’s price, you have to ask whether there is still a buying opportunity here or if the market is already pricing in future growth.
Price-to-Sales of 4.3x: Is it justified?
Kulicke and Soffa Industries is trading on a P/S of 4.3x, and at a last close of $53.99 that level sits above its estimated fair P/S of 3.4x and above the 2.6x peer average, even though it is below the broader US Semiconductor industry average of 5.7x.
The P/S multiple compares the company’s market value to its revenue, which can be useful for equipment makers where earnings can swing around one off items and profitability phases. For KLIC, a 4.3x P/S means investors are paying $4.30 for every $1 of recent revenue.
Relative to similar peers on 2.6x, the current 4.3x P/S suggests the market is assigning a richer tag to KLIC’s revenue base. That sits above the 3.4x fair ratio level that regression analysis indicates the shares could gravitate toward. This hints at a premium that may already reflect expectations for faster growth or improving profitability compared with some competitors.
Against the wider US Semiconductor industry at 5.7x P/S, KLIC trades at a discount, which points to more conservative pricing than some larger or faster growing names in the space, even though the stock still screens as more expensive than both its fair ratio and closer peers on this metric.
Explore the SWS fair ratio for Kulicke and Soffa Industries
Result: Price-to-Sales of 4.3x (OVERVALUED)
However, a richer 4.3x P/S relative to peers, along with revenue concentrated in cyclical semiconductor equipment and Asia Pacific demand, could quickly challenge the current optimism.
Find out about the key risks to this Kulicke and Soffa Industries narrative.
Another view on KLIC’s value
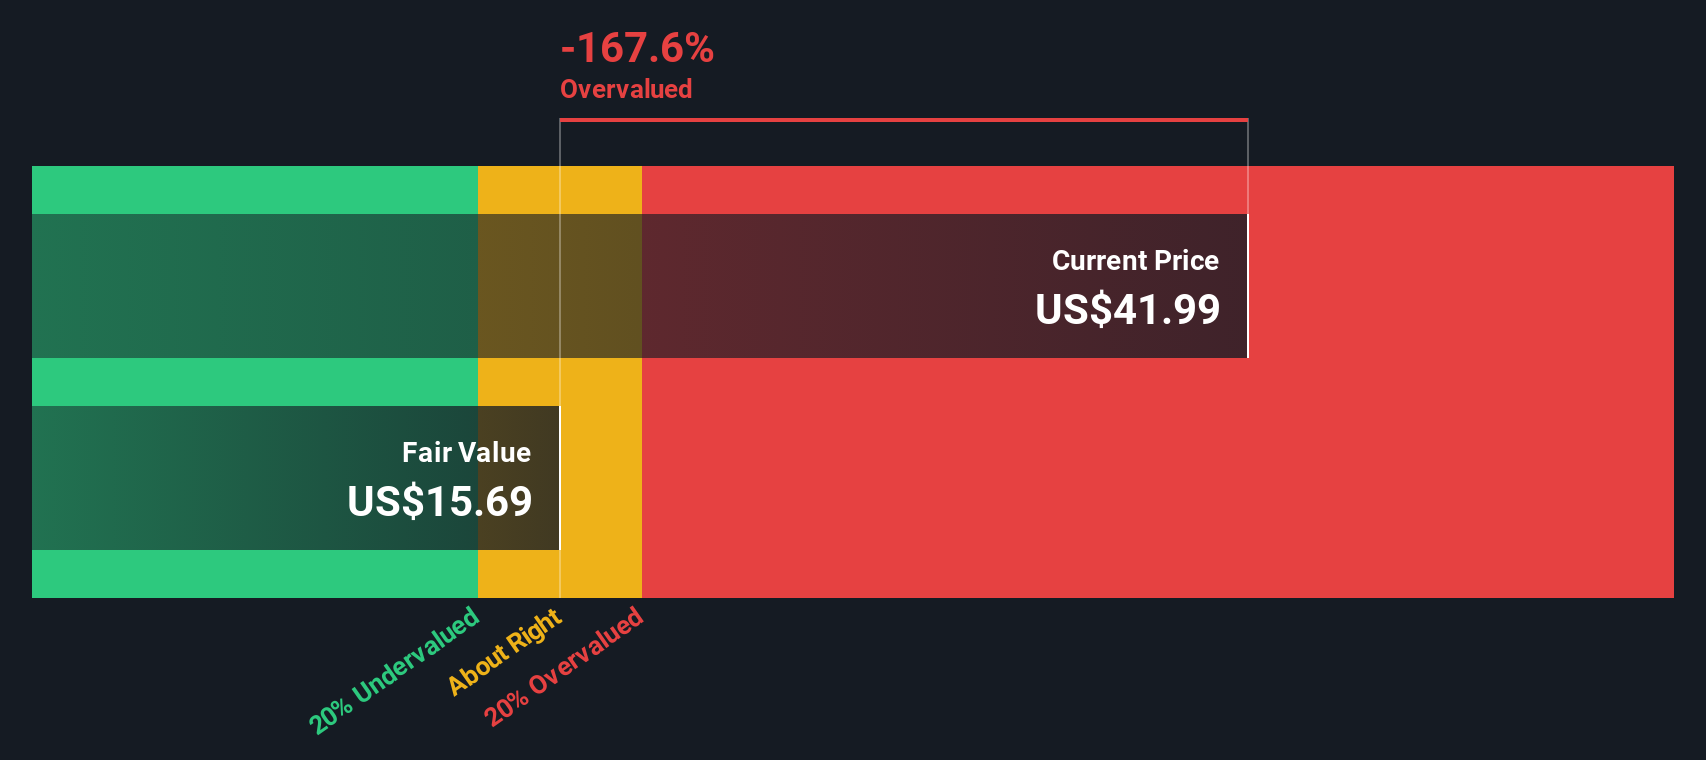
Our DCF model points to a fair value of about $13.75 per share, which is well below the current $53.99 price. That contrasts with a 4.3x P/S, which suggests only a moderate premium. It raises a simple question for you: are cash flow assumptions or revenue multiples telling the sharper story here?
Look into how the SWS DCF model arrives at its fair value.
Simply Wall St performs a discounted cash flow (DCF) on every stock in the world every day (check out Kulicke and Soffa Industries for example). We show the entire calculation in full. You can track the result in your watchlist or portfolio and be alerted when this changes, or use our stock screener to discover 885 undervalued stocks based on their cash flows. If you save a screener we even alert you when new companies match - so you never miss a potential opportunity.
Build Your Own Kulicke and Soffa Industries Narrative
If you look at this and feel differently, or simply prefer to work from your own numbers, you can quickly build a personalised view in just a few minutes, starting with Do it your way.
A great starting point for your Kulicke and Soffa Industries research is our analysis highlighting 2 key rewards and 3 important warning signs that could impact your investment decision.
Looking for more investment ideas?
Do not stop your research with one stock. Use the Simply Wall Street Screener to spot other opportunities that might fit your style and goals.
- Spot potential mispriced opportunities early by checking out these 885 undervalued stocks based on cash flows that may offer more for every dollar of cash flow you pay.
- Ride powerful themes in artificial intelligence by scanning these 26 AI penny stocks that are directly tied to this fast changing trend.
- Tap into income focused ideas by reviewing these 12 dividend stocks with yields > 3% that can help you build a more dependable cash return stream.
This article by Simply Wall St is general in nature. We provide commentary based on historical data and analyst forecasts only using an unbiased methodology and our articles are not intended to be financial advice. It does not constitute a recommendation to buy or sell any stock, and does not take account of your objectives, or your financial situation. We aim to bring you long-term focused analysis driven by fundamental data. Note that our analysis may not factor in the latest price-sensitive company announcements or qualitative material. Simply Wall St has no position in any stocks mentioned.
Have feedback on this article? Concerned about the content? Get in touch with us directly. Alternatively, email editorial-team@simplywallst.com