
 Nasdaq
 华尔街日报
华尔街日报Is It Time To Reassess Lululemon (LULU) After A 46% One-Year Share Price Fall?
- If you are wondering whether lululemon athletica's current share price reflects its true value, you are not alone. Many investors are asking the same question right now.
- The stock last closed at US$211.72, with recent returns of 1.9% over 7 days, 15.7% over 30 days, 0.4% year to date, and a 46.1% decline over 1 year and 32.1% decline over 3 years, alongside a 39.9% decline over 5 years.
- Recent news flow around lululemon has kept attention on how the brand is positioned in the premium athletic and athleisure space, including commentary on competition, product mix, and consumer demand. This context helps frame why the market may be reassessing both the growth profile and the risk attached to the shares.
- On our valuation framework the company earns a value score of 3 out of 6. Next we will walk through the main valuation approaches behind that score, before finishing with a way to look at value that can give you an even clearer picture.
Find out why lululemon athletica's -46.1% return over the last year is lagging behind its peers.
Approach 1: lululemon athletica Discounted Cash Flow (DCF) Analysis
A Discounted Cash Flow, or DCF, model estimates what a business could be worth today by projecting its future cash flows and then discounting those back into present dollars.
For lululemon athletica, the model used is a 2 Stage Free Cash Flow to Equity approach, based on cash flow projections in US$. The latest twelve months free cash flow is about US$1.12b. Analysts provide detailed forecasts for the next few years, and Simply Wall St then extends those out further. By 2035, the projection used in this model is free cash flow of about US$1.50b, with the path between based on a mix of analyst estimates and gradual extrapolations.
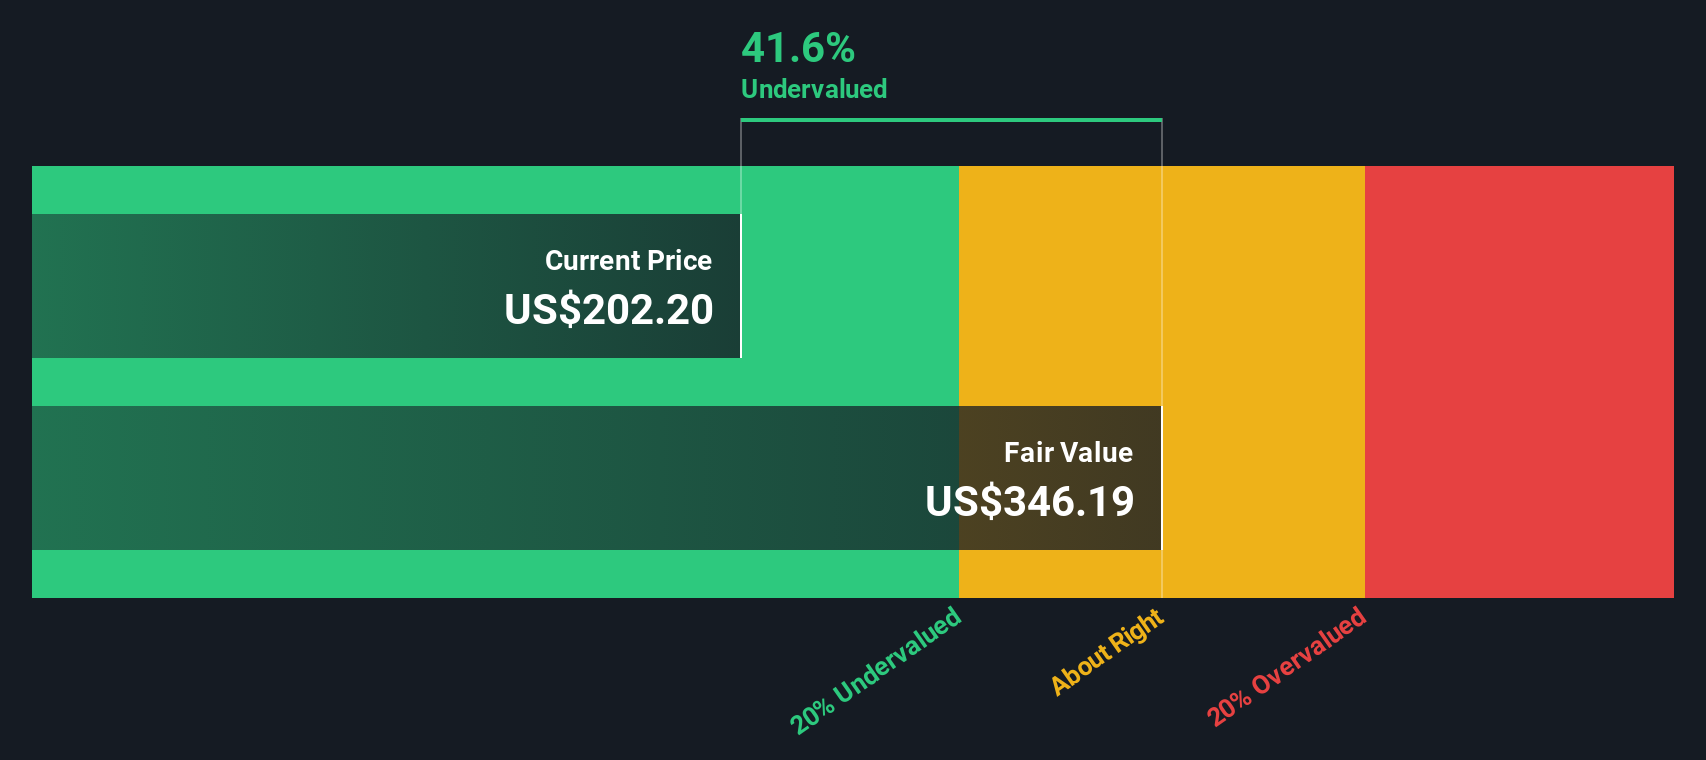
When all those projected cash flows are discounted back, the model arrives at an intrinsic value of roughly US$193.31 per share, compared with a recent market price of US$211.72. That implies the shares are about 9.5% above this DCF estimate, so only slightly rich on this measure.
Result: ABOUT RIGHT
lululemon athletica is fairly valued according to our Discounted Cash Flow (DCF), but this can change at a moment's notice. Track the value in your watchlist or portfolio and be alerted on when to act.
Approach 2: lululemon athletica Price vs Earnings
The P/E ratio is a useful way to think about value for profitable companies because it links what you pay directly to the earnings they are currently generating. In simple terms, it shows how many dollars investors are paying for each dollar of earnings.
What counts as a “normal” P/E depends on what the market expects from a company and how risky those expectations appear. Higher growth expectations or lower perceived risk can justify a higher P/E, while slower growth or higher risk usually lines up with a lower P/E.
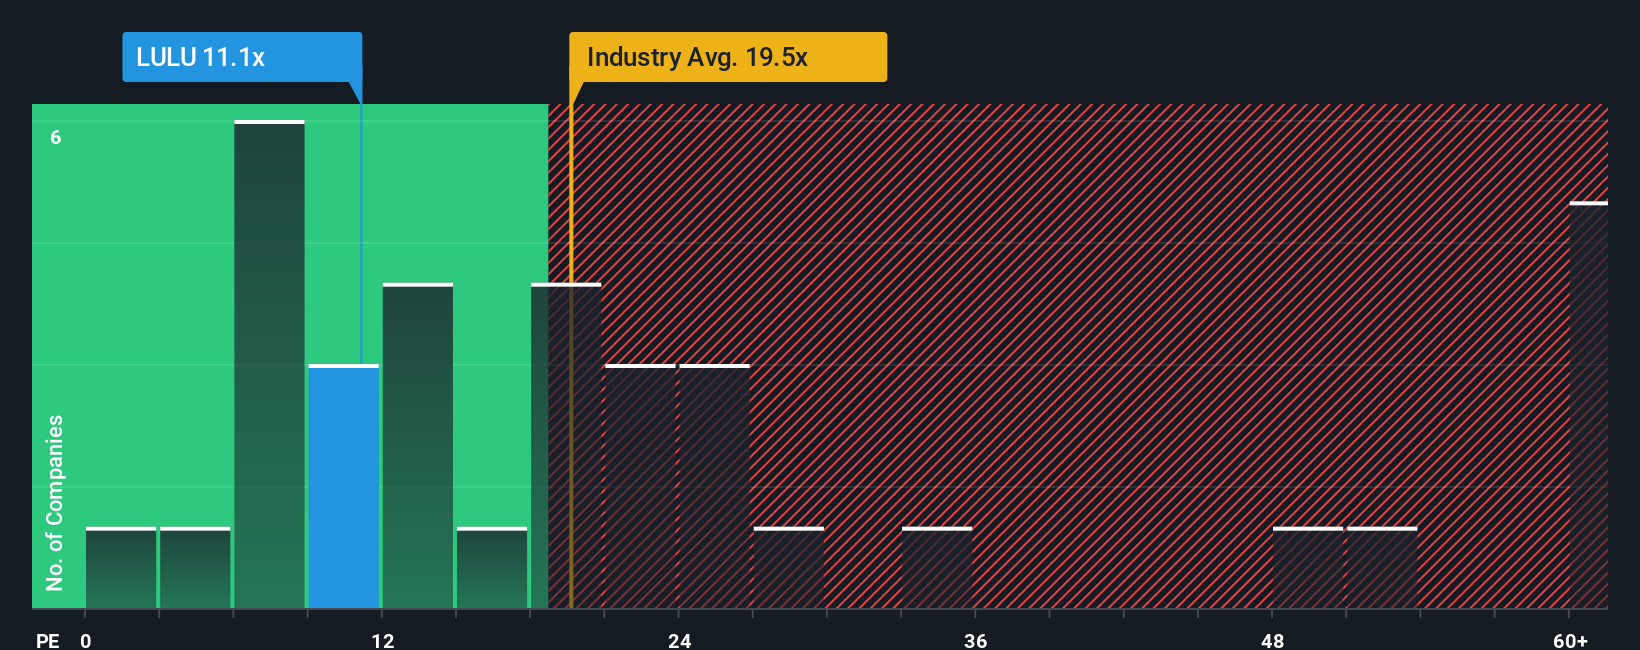
lululemon athletica currently trades on a P/E of about 14.27x, compared with a Luxury industry average of roughly 20.59x and a peer group average around 52.17x. Simply Wall St also calculates a proprietary “Fair Ratio” of 16.60x for lululemon athletica. This Fair Ratio aims to capture what a reasonable P/E might look like after accounting for factors such as earnings growth, profit margins, company size, industry, and company specific risks.
Because the Fair Ratio builds in these fundamentals, it can be more informative than a simple comparison with the industry or peers. With the current P/E below the Fair Ratio by a clear margin, the shares screen as inexpensive on this metric.
Result: UNDERVALUED
P/E ratios tell one story, but what if the real opportunity lies elsewhere? Discover 1449 companies where insiders are betting big on explosive growth.
Upgrade Your Decision Making: Choose your lululemon athletica Narrative
Earlier we mentioned that there is an even better way to understand valuation, so let us introduce you to Narratives. These are simply your own story about lululemon athletica, tied directly to numbers like fair value, future revenue, earnings, and margins.
On Simply Wall St, Narratives live in the Community page and give you an easy tool to connect what you believe about the brand, its product range, competition and execution to a clear financial forecast and a resulting fair value. You can then compare this with the current share price to decide whether the gap between value and price looks attractive or not.
Because Narratives on the platform update as new news, earnings or company announcements appear, the fair value behind each story moves with the information. You can see how different views on the same company lead to different outcomes, for example one lululemon athletica Narrative with a fair value of about US$334.88 and another closer to US$190.19, reflecting contrasting assumptions about growth, margins and risk.
For lululemon athletica, here are previews of two leading lululemon athletica Narratives:
🐂 lululemon athletica Bull Case
Fair value used in this bullish Narrative: about US$334.88 per share.
At the recent price of US$211.72, this Narrative implies the shares are roughly 36.8% below its fair value estimate.
Revenue growth assumption in this Narrative: 5% a year.
- Frames lululemon as undervalued, with a Narrative fair value well above the recent share price.
- Highlights supportive analyst sentiment, with a majority of ratings described as positive and a focus on the brand, products and management execution.
- Points to the company’s position in premium athleisure, expansion efforts and sustainability focus as reasons some investors may see a growth opportunity.
🐻 lululemon athletica Bear Case
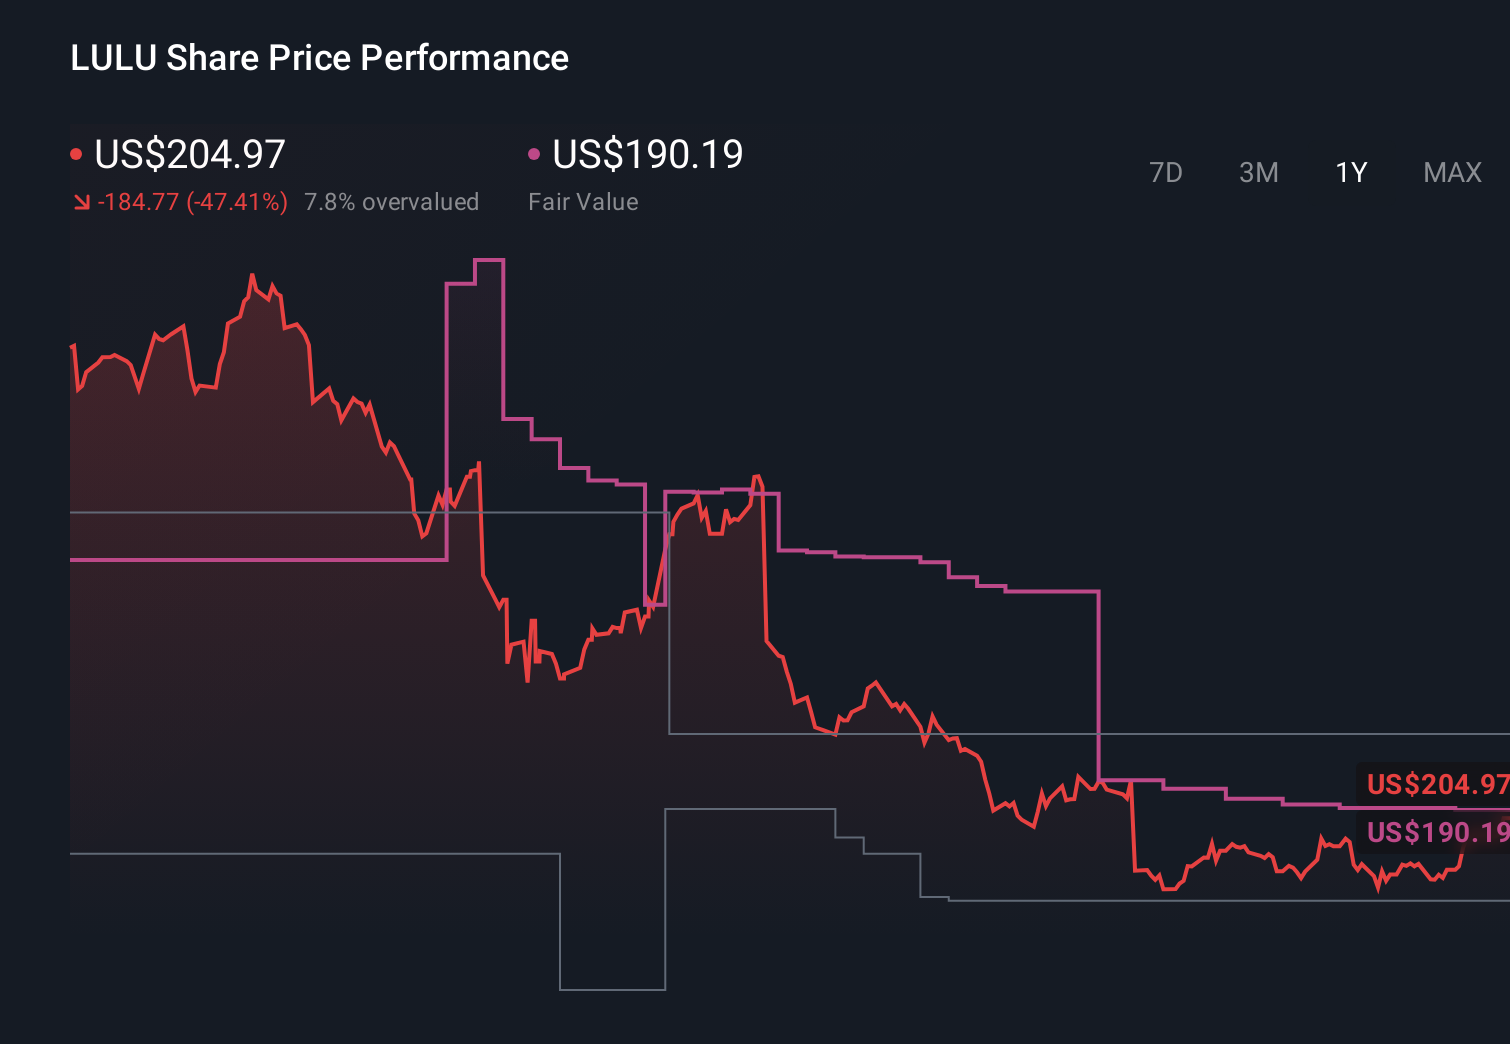
Fair value used in this more cautious Narrative: about US$190.19 per share.
At the recent price of US$211.72, this Narrative implies the shares are roughly 11.3% above its fair value estimate.
Revenue growth assumption in this Narrative: about 4.92% a year.
- Emphasizes execution risks, with tariff pressures, softer U.S. performance and maturing brand power weighing on growth and margins in the Narrative.
- Sets out a detailed earnings path that relies on mid single digit revenue growth, slightly lower profit margins and a mid teens future P/E to support the valuation.
- Flags competition, leadership changes and changing consumer spending patterns as key risks that could cap upside and justify a lower fair value.
If you want to see how your own view lines up with these, you can start with these two previews, then build or adjust a Narrative that matches your expectations for lululemon’s growth, margins and risk profile.
Curious how numbers become stories that shape markets? Explore Community Narratives
Do you think there's more to the story for lululemon athletica? Head over to our Community to see what others are saying!
This article by Simply Wall St is general in nature. We provide commentary based on historical data and analyst forecasts only using an unbiased methodology and our articles are not intended to be financial advice. It does not constitute a recommendation to buy or sell any stock, and does not take account of your objectives, or your financial situation. We aim to bring you long-term focused analysis driven by fundamental data. Note that our analysis may not factor in the latest price-sensitive company announcements or qualitative material. Simply Wall St has no position in any stocks mentioned.
Have feedback on this article? Concerned about the content? Get in touch with us directly. Alternatively, email editorial-team@simplywallst.com