
 Nasdaq
 华尔街日报
华尔街日报Is It Too Late To Consider Amkor Technology (AMKR) After Its Recent Share Price Surge?
- If you are wondering whether Amkor Technology's current share price lines up with its real worth, this article will walk through what the numbers say and where valuation checks are pointing.
- The stock last closed at US$51.29, with returns of 27.0% over 7 days, 18.6% over 30 days, 19.5% year to date, 95.9% over 1 year, 84.1% over 3 years and 211.0% over 5 years. This naturally raises questions about how its recent performance lines up with underlying value.
- Recent coverage around Amkor has focused on its role in the semiconductor packaging and test space and its position within the broader chip supply chain. This gives investors more context on how it fits into demand for outsourced manufacturing services. Commentary has also highlighted the stock's place among US listed semiconductors, which helps frame how the market may be thinking about its risk profile and growth potential.
- On Simply Wall St's valuation checks, Amkor Technology currently scores 2 out of 6. We will look at what different valuation methods say about that score, and then finish with a more complete way to think about valuation that goes beyond the usual metrics.
Amkor Technology scores just 2/6 on our valuation checks. See what other red flags we found in the full valuation breakdown.
Approach 1: Amkor Technology Discounted Cash Flow (DCF) Analysis
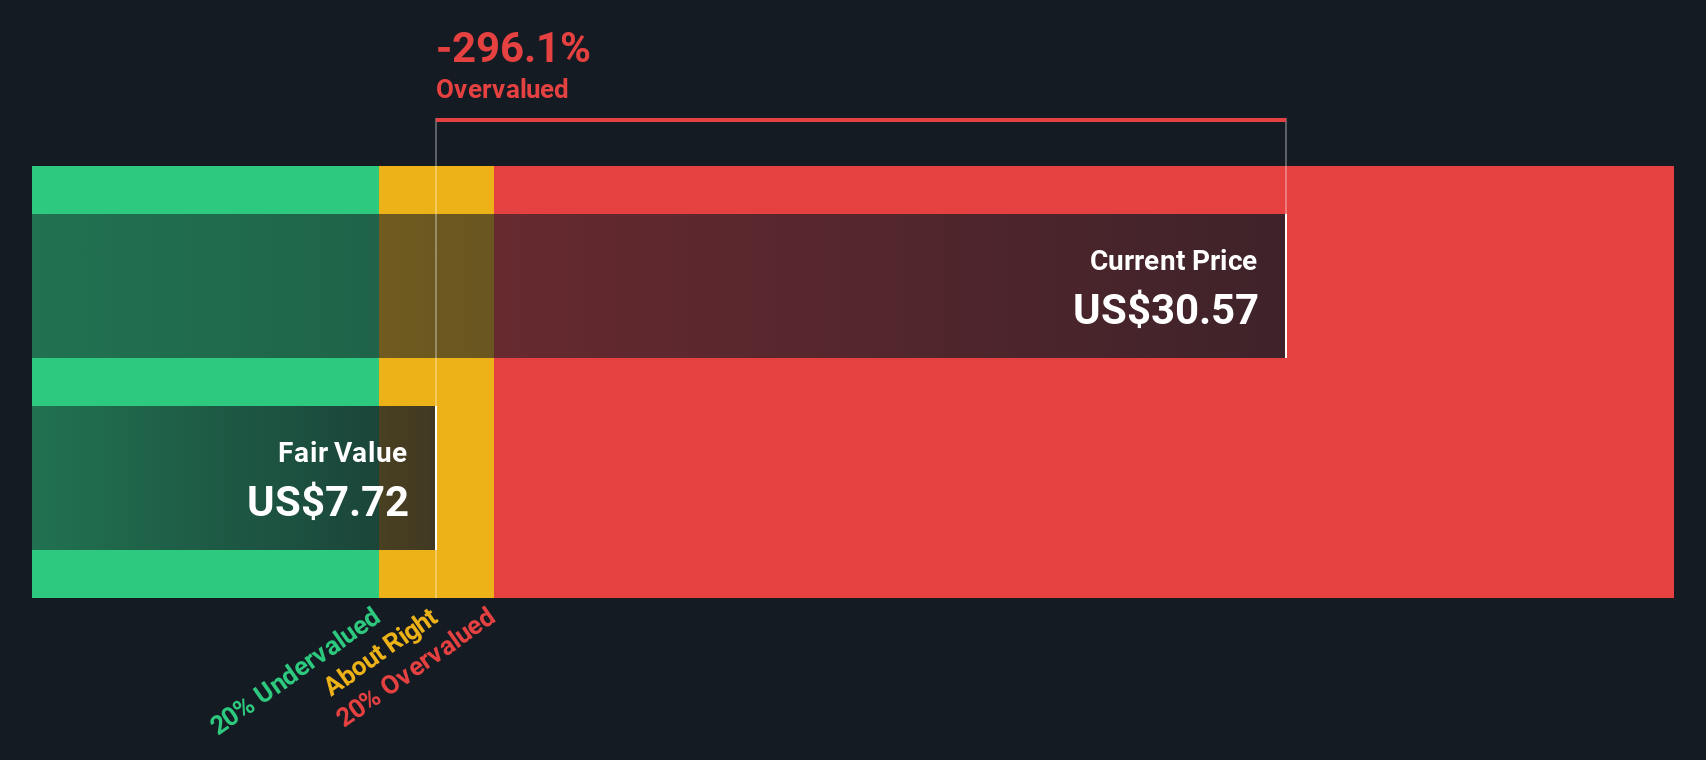
A Discounted Cash Flow, or DCF, model looks at the cash Amkor Technology is expected to generate in the future, then discounts those projected cash flows back to today to estimate what the business might be worth right now.
For Amkor, the latest twelve month Free Cash Flow is about $230.4 million. Analysts supply explicit Free Cash Flow estimates for the next few years, and Simply Wall St then extrapolates further out using a 2 Stage Free Cash Flow to Equity model. Under this framework, projected Free Cash Flow for 2028 is $257.4 million, with additional estimates running through 2035, all in dollars and all discounted back to today to account for the time value of money and risk.
Adding those discounted cash flows together gives an estimated intrinsic value of about $12.65 per share for Amkor Technology. Compared with the recent share price of $51.29, the model suggests the stock is 305.6% above this DCF estimate, which points to a rich valuation on this specific cash flow based approach.
Result: OVERVALUED
Our Discounted Cash Flow (DCF) analysis suggests Amkor Technology may be overvalued by 305.6%. Discover 877 undervalued stocks or create your own screener to find better value opportunities.
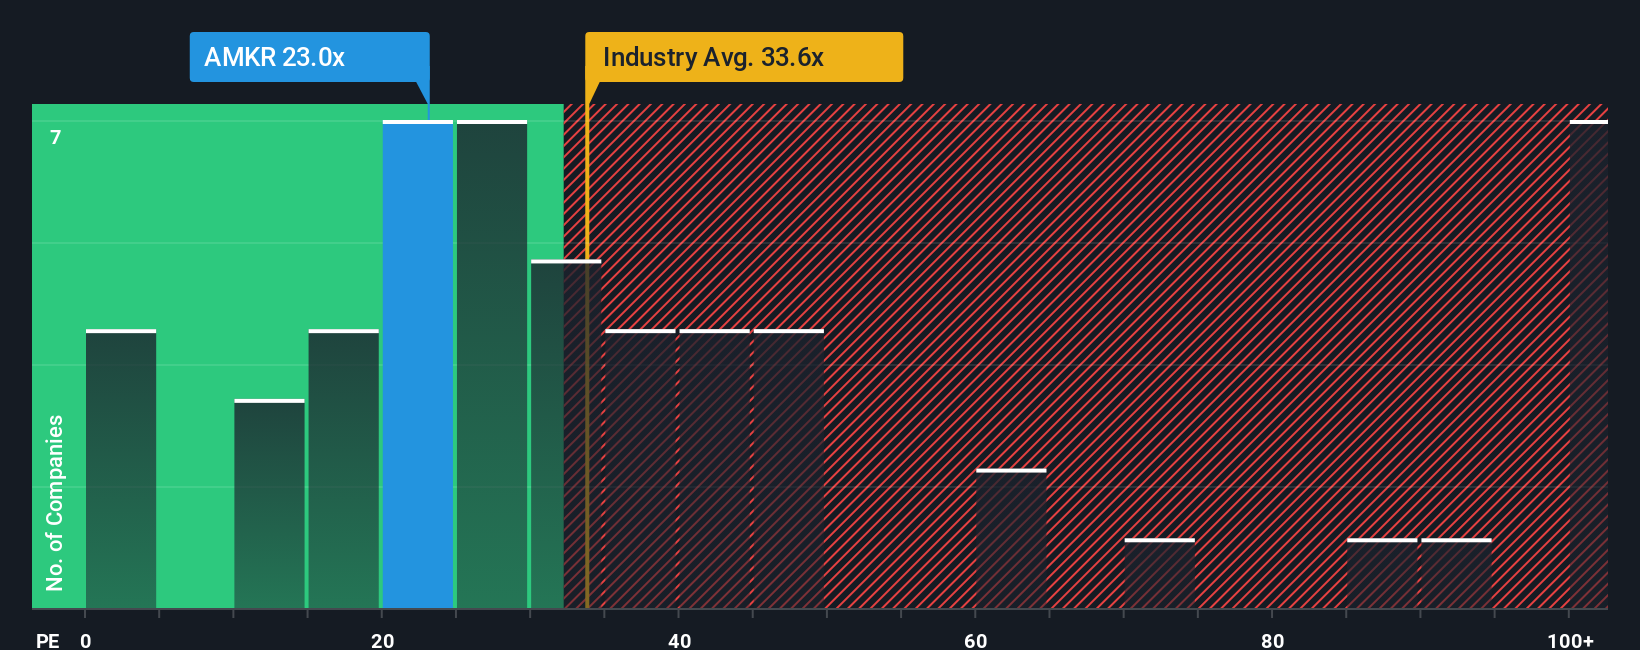
Approach 2: Amkor Technology Price vs Earnings
For a profitable company like Amkor Technology, the P/E ratio is a useful yardstick because it links what you pay for the stock to the earnings the business is currently generating. Investors usually accept a higher P/E when they expect stronger growth or see lower risk, and a lower P/E when they expect slower growth or higher risk.
Amkor’s current P/E is 41.19x. That is in line with the broader Semiconductor industry average P/E of 41.19x, and below the peer group average of 49.24x. On the surface, that indicates the market is valuing Amkor roughly in step with the sector, and at a discount to its peer set.
Simply Wall St’s Fair Ratio for Amkor is 39.98x. This is a proprietary estimate of what the P/E might be given factors such as the company’s earnings growth profile, industry, profit margins, market capitalization and specific risks. Because it blends these company level inputs, the Fair Ratio can be more tailored than a simple comparison to peers or the overall industry. With the current P/E at 41.19x compared with a Fair Ratio of 39.98x, the shares screen as modestly overvalued on this metric.
Result: OVERVALUED
P/E ratios tell one story, but what if the real opportunity lies elsewhere? Discover 1450 companies where insiders are betting big on explosive growth.
Upgrade Your Decision Making: Choose your Amkor Technology Narrative
Earlier we mentioned that there is an even better way to understand valuation. Let us introduce you to Narratives, a simple way for you to put a story behind your numbers for Amkor Technology, including your own view of fair value and your estimates for future revenue, earnings and margins.
A Narrative links three pieces together: the company story you believe, the financial forecast that story implies, and the fair value you arrive at from those forecasts, so you can see clearly how your view translates into a number.
On Simply Wall St, Narratives sit in the Community page and are used by millions of investors, giving you an easy way to compare your assumptions with others, see whether your fair value is above or below the current price and decide if that means the stock might be attractive to you or something you prefer to avoid.
Because Narratives update automatically when new information such as earnings reports or major news is added to the platform, your fair value and thesis stay current without you having to rebuild everything from scratch. For Amkor Technology, that might mean one investor has a very low fair value based on cautious revenue and margin forecasts, while another has a far higher fair value based on a stronger long term demand view for outsourced chip packaging and testing.
Do you think there's more to the story for Amkor Technology? Head over to our Community to see what others are saying!

This article by Simply Wall St is general in nature. We provide commentary based on historical data and analyst forecasts only using an unbiased methodology and our articles are not intended to be financial advice. It does not constitute a recommendation to buy or sell any stock, and does not take account of your objectives, or your financial situation. We aim to bring you long-term focused analysis driven by fundamental data. Note that our analysis may not factor in the latest price-sensitive company announcements or qualitative material. Simply Wall St has no position in any stocks mentioned.
Have feedback on this article? Concerned about the content? Get in touch with us directly. Alternatively, email editorial-team@simplywallst.com