
 Nasdaq
 华尔街日报
华尔街日报Assessing Energizer Holdings (ENR) Valuation After Recent Share Price Momentum Shift
Energizer Holdings (ENR) is back on investor radars after recent share price moves, with the stock showing mixed performance over the past year and longer term. This is prompting fresh questions about how its fundamentals line up.
See our latest analysis for Energizer Holdings.
The recent 1 day share price return of 5.32% and 1 month share price return of 10.87% come after a much weaker patch, with the 1 year total shareholder return at a 39.06% loss. This suggests short term momentum is picking up while longer term performance has lagged.
If Energizer’s moves have you reassessing your watchlist, it could be a good moment to broaden your search with fast growing stocks with high insider ownership.
With the shares down on a 1 year view but up sharply in recent weeks, and with metrics like value score and analyst targets in focus, is Energizer quietly undervalued here, or is the market already pricing in future growth?
Price-to-Earnings of 5.8x: Is it justified?
At a last close of US$20.19, Energizer Holdings trades on a P/E of 5.8x, which suggests the market price is low compared to earnings when set against peers and industry benchmarks.
The P/E multiple tells you how much investors are paying today for each dollar of current earnings. For a consumer and household products group that already reports positive earnings, this is a straightforward way to compare its valuation with similar companies.
According to the Simply Wall St checks, Energizer is described as trading at good value compared to peers and the wider industry. Its 5.8x P/E is materially lower than the global Household Products industry average P/E of 16.6x, and also well below an estimated fair P/E of 12.7x that the SWS model suggests the market could move towards over time if sentiment and fundamentals align.
This gap stands out even more when you compare the 5.8x P/E to a peer group average of 17.7x, which points to a sizeable discount versus similar companies in the same space.
Explore the SWS fair ratio for Energizer Holdings
Result: Price-to-Earnings of 5.8x (UNDERVALUED)
However, the 39.06% 1 year and 47.66% 5 year total shareholder return declines, plus a 38.75% 3 year drop, suggest that sentiment could remain fragile.
Find out about the key risks to this Energizer Holdings narrative.
Another View: What Our DCF Model Suggests
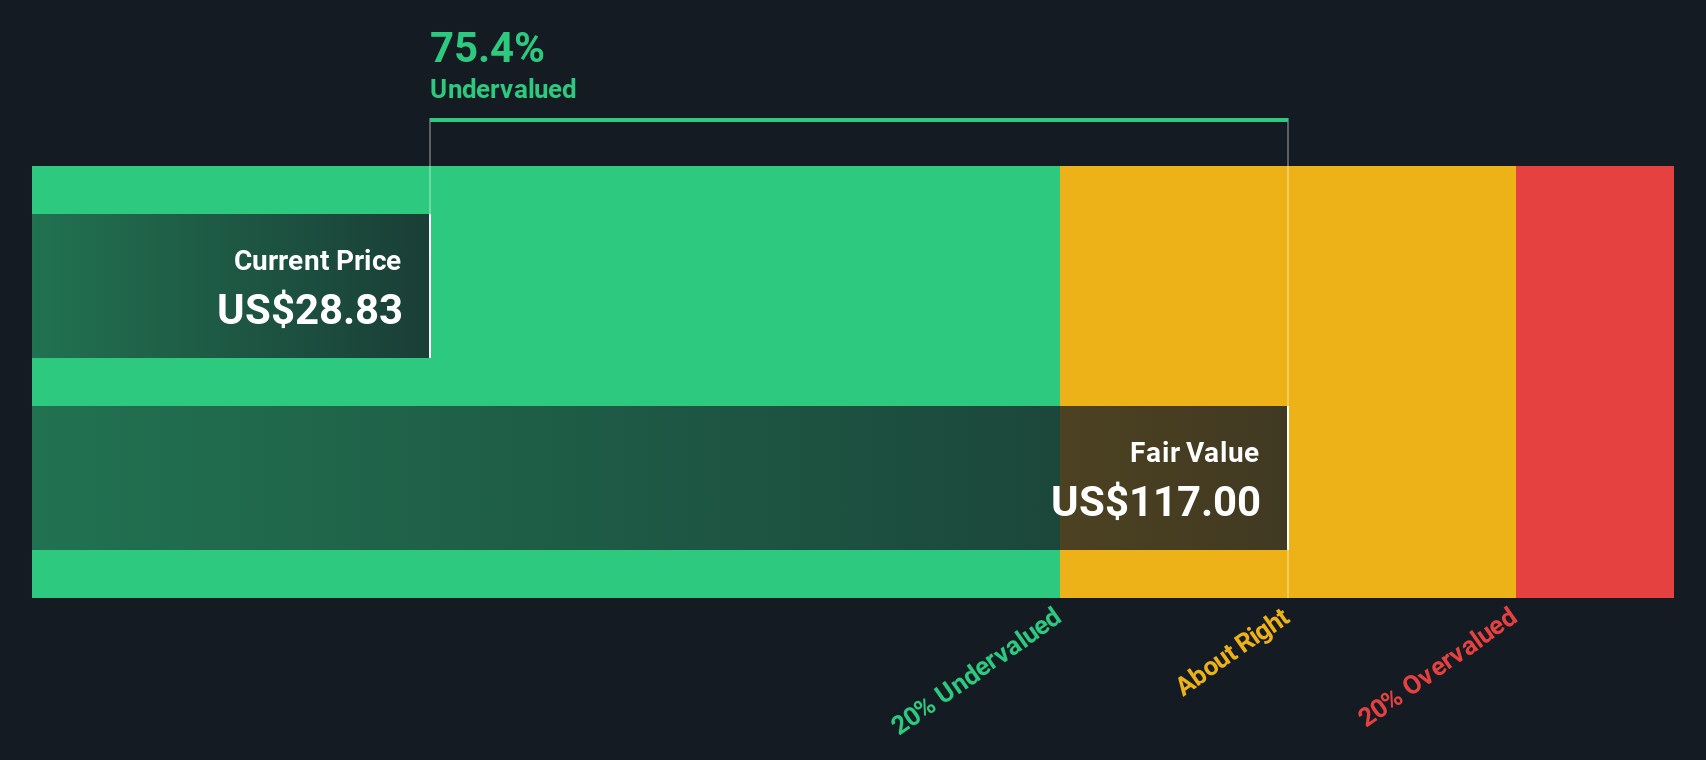
While the 5.8x P/E hints at a low price compared to earnings, our DCF model paints an even starker picture. At a current price of US$20.19 versus an estimated fair value of US$91.16, the shares screen as heavily undervalued on this approach. So which signal should investors rely on more: the market or the cash flow math?
Look into how the SWS DCF model arrives at its fair value.
Simply Wall St performs a discounted cash flow (DCF) on every stock in the world every day (check out Energizer Holdings for example). We show the entire calculation in full. You can track the result in your watchlist or portfolio and be alerted when this changes, or use our stock screener to discover 877 undervalued stocks based on their cash flows. If you save a screener we even alert you when new companies match - so you never miss a potential opportunity.
Build Your Own Energizer Holdings Narrative
If you see the numbers differently or prefer to weigh the data in your own way, you can build a personalised view in just a few minutes: Do it your way.
A great starting point for your Energizer Holdings research is our analysis highlighting 4 key rewards and 3 important warning signs that could impact your investment decision.
Looking for more investment ideas?
If Energizer has caught your attention, do not stop there. You could miss other opportunities the screener surfaces across very different corners of the market.
- Target potential bargains by checking out these 877 undervalued stocks based on cash flows that currently trade at prices the model flags as below their estimated worth.
- Explore technology-focused opportunities by scanning these 25 AI penny stocks that are tied to artificial intelligence themes across multiple industries.
- Hunt for yield by reviewing these 11 dividend stocks with yields > 3% that offer income-focused profiles with yields above 3%.
This article by Simply Wall St is general in nature. We provide commentary based on historical data and analyst forecasts only using an unbiased methodology and our articles are not intended to be financial advice. It does not constitute a recommendation to buy or sell any stock, and does not take account of your objectives, or your financial situation. We aim to bring you long-term focused analysis driven by fundamental data. Note that our analysis may not factor in the latest price-sensitive company announcements or qualitative material. Simply Wall St has no position in any stocks mentioned.
Have feedback on this article? Concerned about the content? Get in touch with us directly. Alternatively, email editorial-team@simplywallst.com