
 Nasdaq
 华尔街日报
华尔街日报Is Roku (ROKU) Still Attractively Priced After Recent Share Price Rebound?
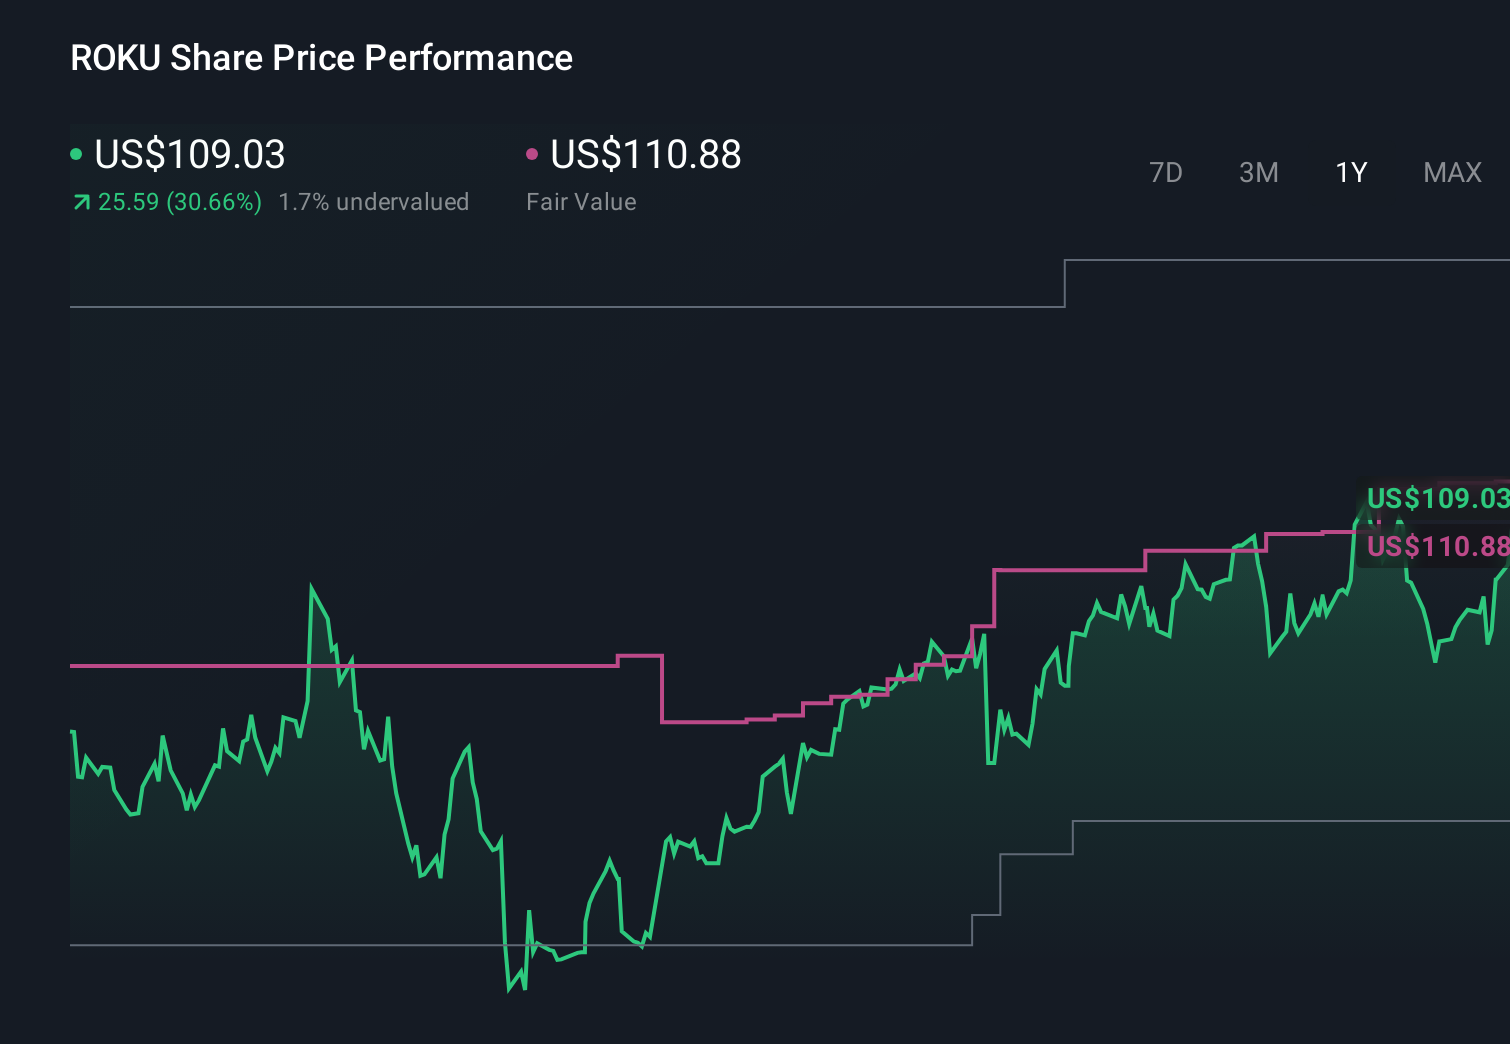
- Wondering if Roku at US$113.28 is still a bargain or already pricing in the story? This article will help you make sense of where the stock sits on the value spectrum.
- The share price return sits at 2.2% over 7 days, 13.2% over 30 days, 4.2% year to date, 45.2% over 1 year, 140.4% over 3 years, and a 72.7% decline over 5 years. This raises questions about how the current price lines up with fundamentals.
- Recent headlines around Roku have focused on its position in the streaming and connected TV space and how investors are thinking about the long term role of its platform, especially as competition and content distribution models continue to evolve. This context helps frame whether the recent share price moves reflect changing expectations around its business model or simply shifting sentiment.
- Roku currently has a valuation score of 3 out of 6. This means it screens as undervalued on half of the checks we run. Next we will walk through what different valuation methods say about that number and hint at an even better way to think about value at the end of this article.
Approach 1: Roku Discounted Cash Flow (DCF) Analysis
A DCF model takes estimates of a company’s future cash flows, then discounts them back to today using a required rate of return, to arrive at an estimate of what the business might be worth right now.
For Roku, the model used is a 2 Stage Free Cash Flow to Equity approach. The latest twelve month free cash flow sits at about $394.9 million. Analyst and extrapolated projections in the model have free cash flow reaching about $1.6b in 2030, with interim years ranging from about $696.5 million in 2026 to $2.2b in 2035, all in $ and then discounted back to today.
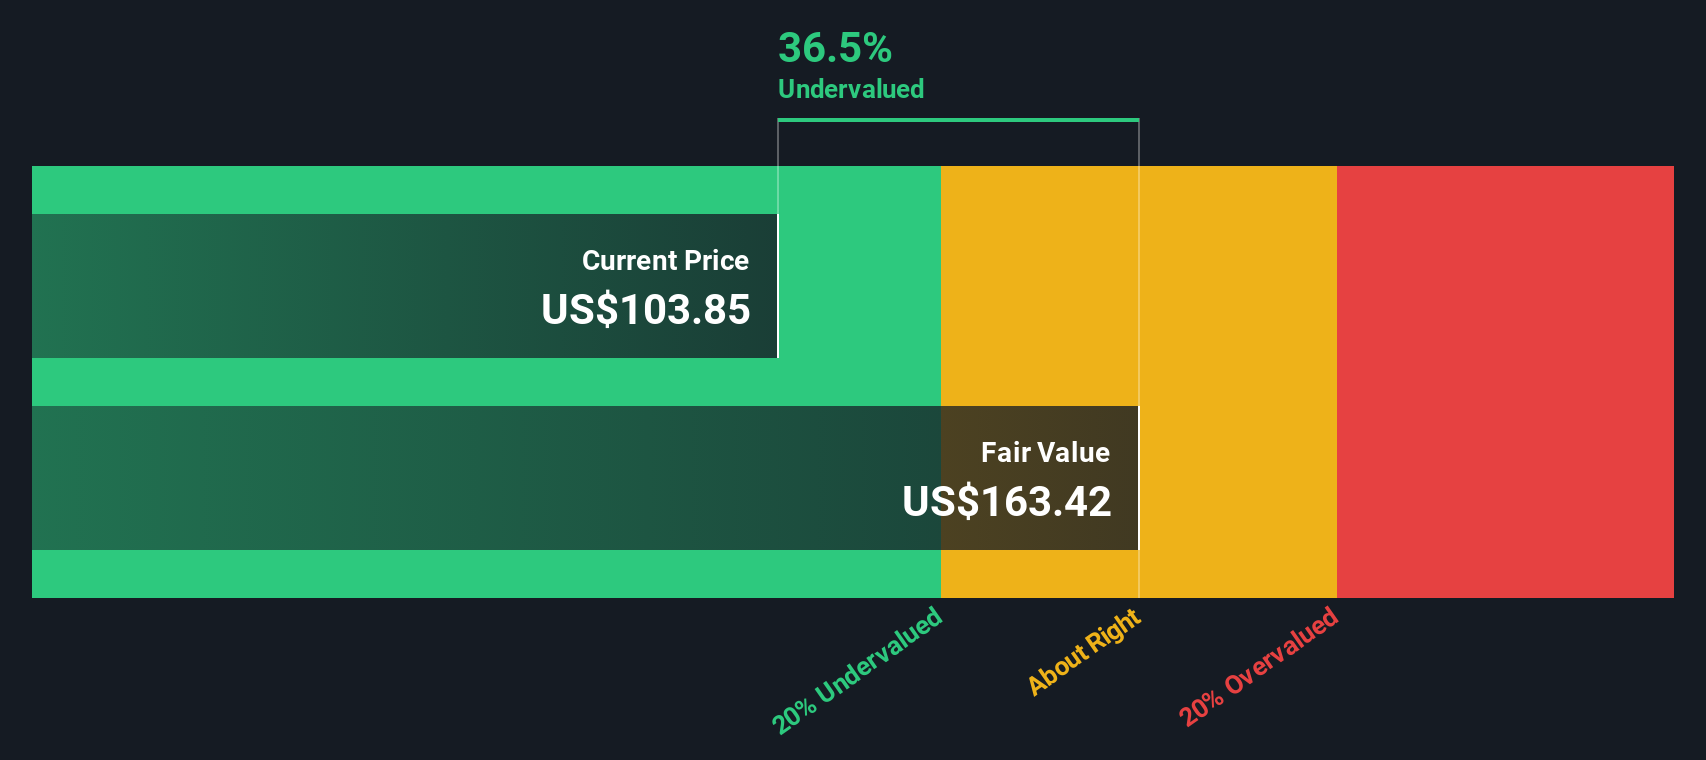
Putting those projections together, the DCF output suggests an estimated intrinsic value of about $178.86 per share. Against the recent share price of US$113.28, the model implies the stock trades at roughly a 36.7% discount, which screens as undervalued on this basis.
Result: UNDERVALUED
Our Discounted Cash Flow (DCF) analysis suggests Roku is undervalued by 36.7%. Track this in your watchlist or portfolio, or discover 877 more undervalued stocks based on cash flows.
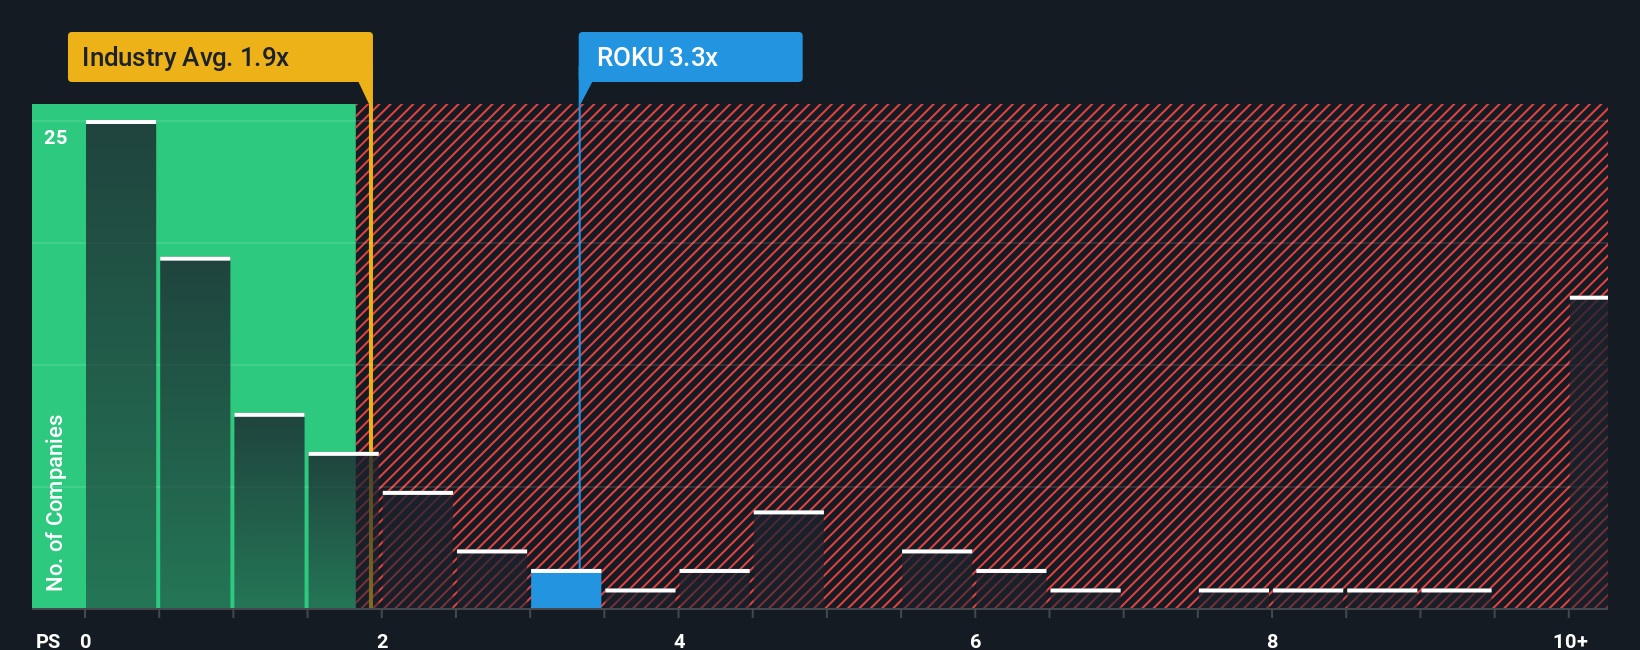
Approach 2: Roku Price vs Sales
For companies where investors are focused on revenue scale and market position, P/S can be a useful way to compare what the market is paying for each dollar of sales, especially when earnings are less of a focus.
Growth expectations and risk still matter here, because a higher P/S is usually associated with companies where investors expect stronger revenue growth or see the business as less risky, while a lower P/S can reflect more muted expectations or higher perceived risk.
Roku’s current P/S ratio is about 3.68x. That sits above the Entertainment industry average of around 1.57x and slightly below the peer group average of about 3.94x. Simply Wall St also calculates a proprietary “Fair Ratio” for Roku of 2.51x. This is the P/S level it might trade on given inputs like earnings growth, industry, profit margins, market cap and risk.
This Fair Ratio can be more tailored than a simple comparison with peers or the industry, because it tries to adjust for Roku’s specific profile rather than assuming all companies in the same sector deserve similar multiples.
Comparing Roku’s current P/S of 3.68x to the Fair Ratio of 2.51x suggests the shares screen as overvalued on this metric.
Result: OVERVALUED
P/S ratios tell one story, but what if the real opportunity lies elsewhere? Discover 1448 companies where insiders are betting big on explosive growth.
Upgrade Your Decision Making: Choose your Roku Narrative
Earlier we mentioned that there is an even better way to understand valuation, so let us introduce you to Narratives. These are simply your story about a company, tied directly to your assumptions for its future revenue, earnings, margins and fair value, all brought together into a forecast that you can compare with the current share price.
On Simply Wall St’s Community page, Narratives let you connect Roku’s business story, such as expectations around streaming adoption, advertising, margins or competition, to a clear set of numbers and a fair value estimate that sits next to today’s price. This allows you to quickly see whether your story suggests you should be more interested in buying, holding, or selling.
Because Narratives on the platform update automatically when new information arrives, such as quarterly earnings, analyst revisions or major partnership news, your fair value view for Roku stays in sync with the latest data without you needing to rebuild your model each time.
For example, one Roku Narrative on the platform might use assumptions similar to the higher analyst fair value of about US$130 per share, while another could sit closer to the lower end around US$70. Seeing these side by side can help you decide which story feels closer to how you see Roku’s future.
Do you think there's more to the story for Roku? Head over to our Community to see what others are saying!
This article by Simply Wall St is general in nature. We provide commentary based on historical data and analyst forecasts only using an unbiased methodology and our articles are not intended to be financial advice. It does not constitute a recommendation to buy or sell any stock, and does not take account of your objectives, or your financial situation. We aim to bring you long-term focused analysis driven by fundamental data. Note that our analysis may not factor in the latest price-sensitive company announcements or qualitative material. Simply Wall St has no position in any stocks mentioned.
Have feedback on this article? Concerned about the content? Get in touch with us directly. Alternatively, email editorial-team@simplywallst.com