
 Nasdaq
 华尔街日报
华尔街日报Is MSCI (MSCI) Pricing Look Stretched After Recent Share Price Gains?
- If you are wondering whether MSCI's current share price reflects its underlying worth, you are not alone. Many investors are asking the same question right now.
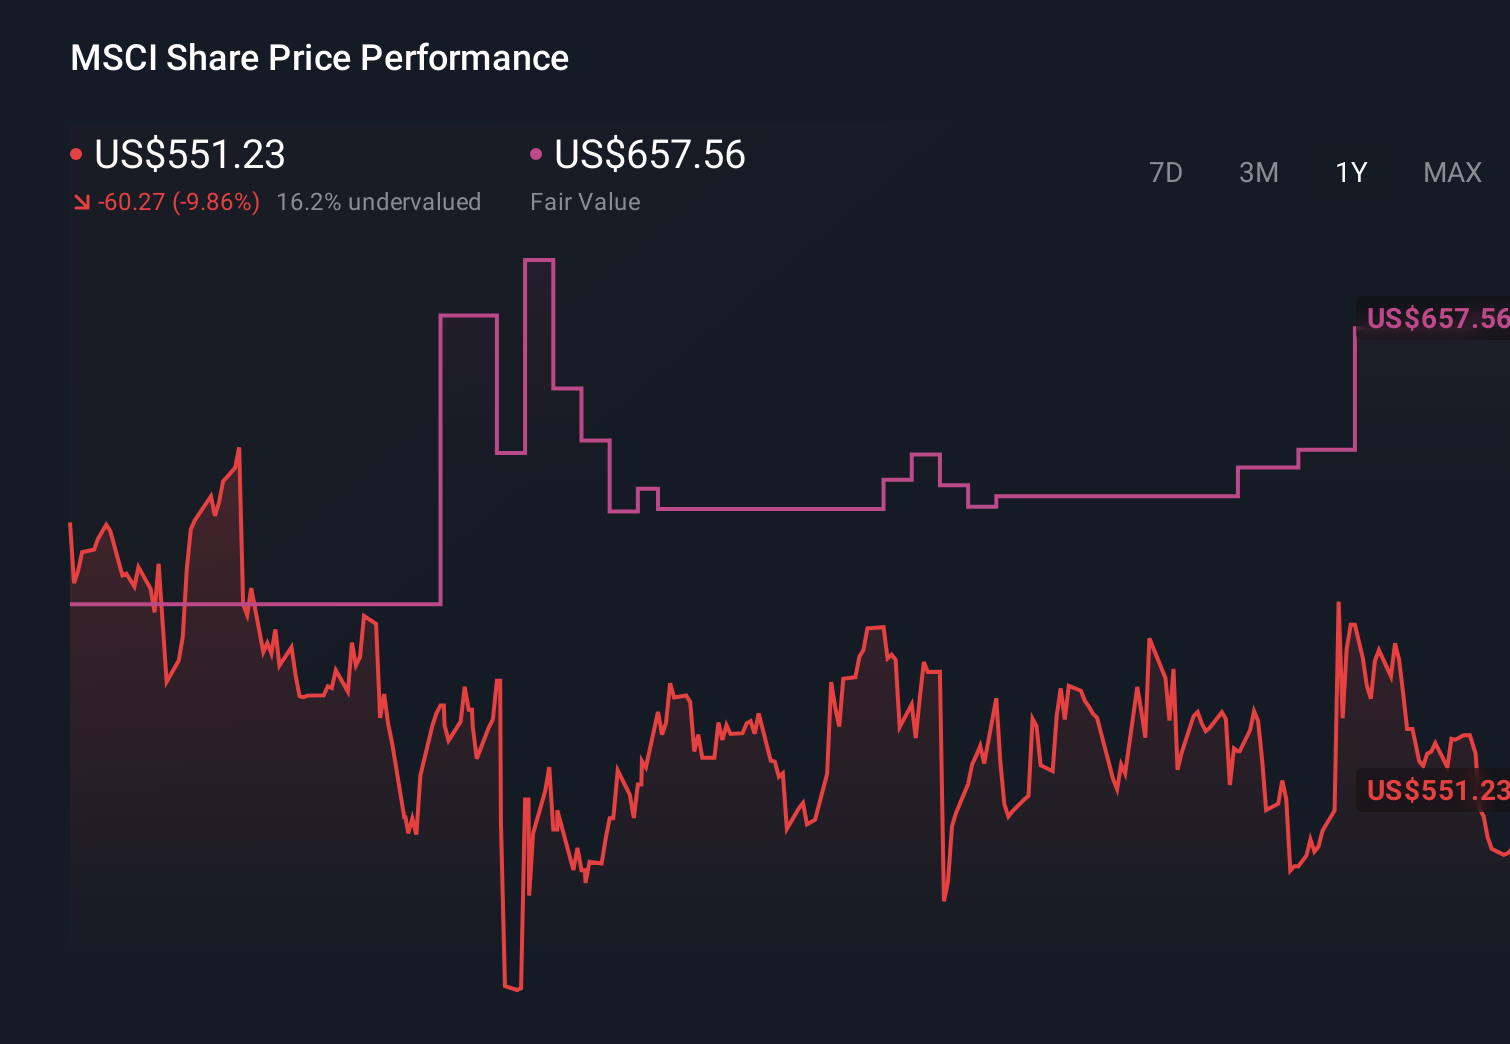
- The stock last closed at US$586.96, with returns of 0.8% over 7 days, 9.0% over 30 days, 3.8% year to date, 0.5% over 1 year, 24.5% over 3 years and 36.3% over 5 years. This provides plenty of data points for thinking about how the market is pricing the business.
- Recent market interest in MSCI has been shaped by ongoing attention to index and analytics providers and their role in portfolio construction and risk management. This backdrop helps explain why shorter term moves, such as the 30 day return, may look different to the more modest 1 year figure.
- Even so, MSCI currently scores 0/6 on our valuation checks. This suggests there is a gap between its market price and our basic screening results. Next we will walk through standard valuation approaches, before finishing with a different way of thinking about value that many readers may find more useful.
MSCI scores just 0/6 on our valuation checks. See what other red flags we found in the full valuation breakdown.
Approach 1: MSCI Discounted Cash Flow (DCF) Analysis
A Discounted Cash Flow, or DCF, model estimates what a business could be worth by projecting its future cash flows and then discounting those amounts back to today. It is essentially asking what those future dollars are worth in present terms.
For MSCI, the model used is a 2 Stage Free Cash Flow to Equity approach. The latest twelve month free cash flow is about US$1.40b. Analysts have provided free cash flow estimates for several years, and Simply Wall St extends those projections further, with free cash flow in 2035 modeled at roughly US$2.84b, all expressed in US$.
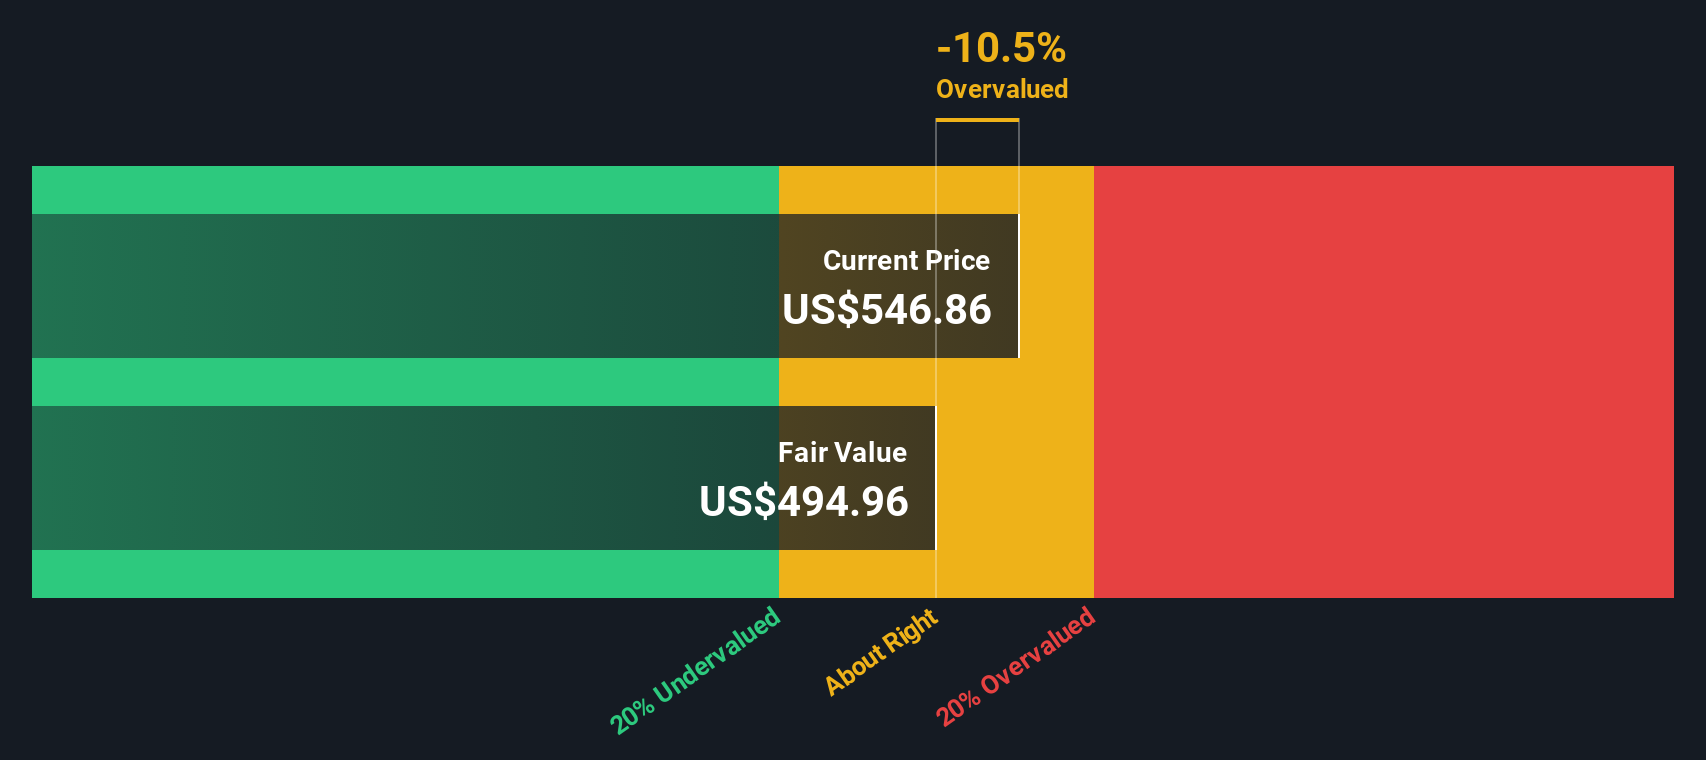
When all of those projected cash flows are discounted back, the DCF output points to an estimated intrinsic value of about US$526.51 per share. Compared with the recent share price of US$586.96, this implies the stock is around 11.5% overvalued based on this model alone.
Result: OVERVALUED
Our Discounted Cash Flow (DCF) analysis suggests MSCI may be overvalued by 11.5%. Discover 875 undervalued stocks or create your own screener to find better value opportunities.
Approach 2: MSCI Price vs Earnings
The P/E ratio is a common way to value profitable companies because it links what you pay for each share to the earnings that business is currently generating. It gives you a quick sense of how many years of current earnings the market is pricing into the stock.
What counts as a “normal” P/E usually reflects two things: how fast earnings are expected to grow and how risky those earnings are. Higher expected growth or lower perceived risk can support a higher P/E, while slower growth or higher risk usually points to a lower one.
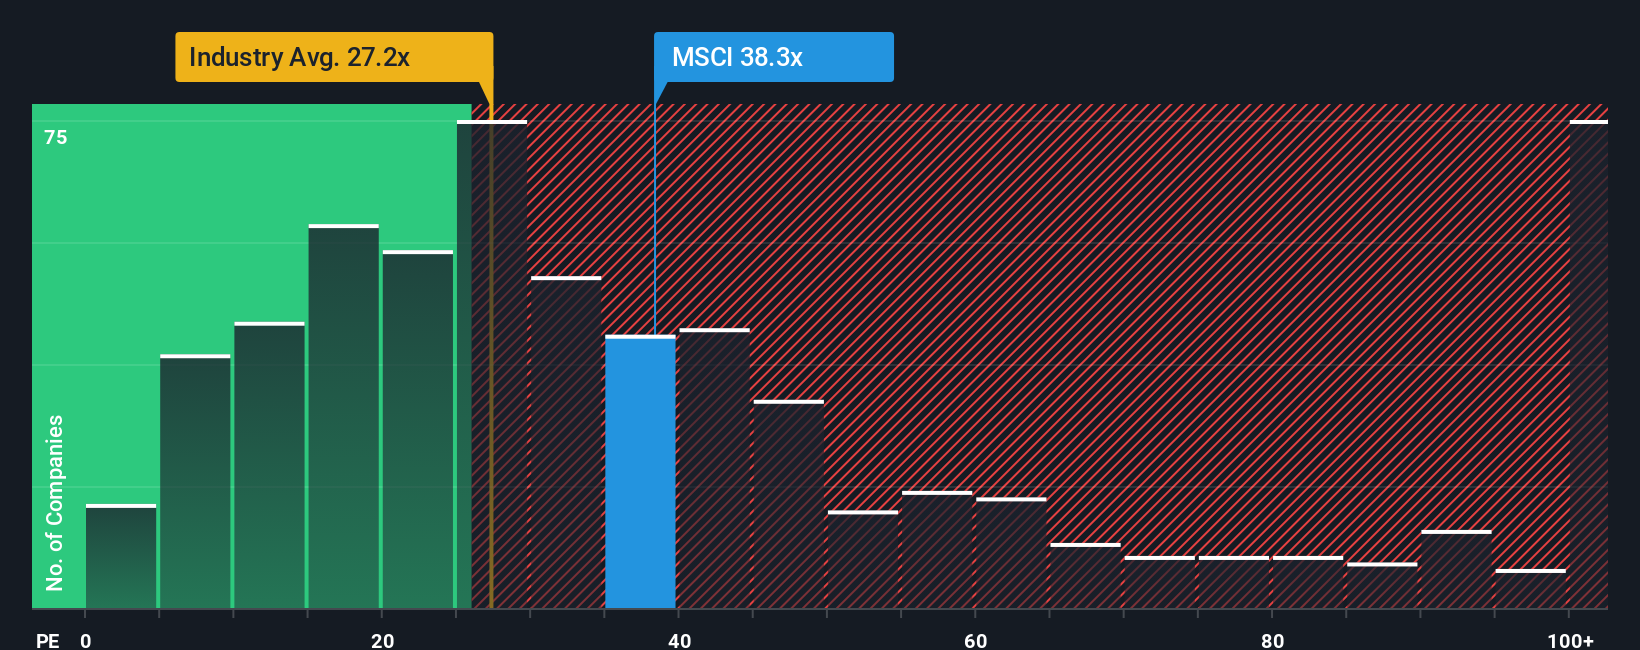
MSCI is currently trading on a P/E of 36.06x. That sits above the Capital Markets industry average P/E of 25.75x and is also slightly above the peer group average of 35.50x. Simply Wall St’s Fair Ratio for MSCI is 17.13x, which is its proprietary view of what a more appropriate P/E might be after considering factors such as earnings growth, margins, industry, market cap and risk.
The Fair Ratio can be more useful than a straight peer or industry comparison because it attempts to adjust for those business specific drivers rather than just comparing headline multiples. With MSCI’s current P/E of 36.06x versus a Fair Ratio of 17.13x, the shares look expensive on this metric.
Result: OVERVALUED
P/E ratios tell one story, but what if the real opportunity lies elsewhere? Discover 1447 companies where insiders are betting big on explosive growth.
Upgrade Your Decision Making: Choose your MSCI Narrative
Earlier we mentioned that there is an even better way to understand valuation, so let us introduce you to Narratives. This simply means you write the story you believe about MSCI, link that story to clear assumptions for future revenue, earnings and margins, and then see the fair value that follows from those numbers. All of this is available in an easy tool on Simply Wall St’s Community page used by millions of investors, where Narratives refresh automatically when new earnings or news arrive. For example, one investor might build a more upbeat MSCI Narrative that lines up with a fair value around the higher analyst target of US$700, while another uses more cautious assumptions closer to US$520. Each can then compare their fair value to today’s share price to decide whether the stock looks attractively priced or not based on their own view.
Do you think there's more to the story for MSCI? Head over to our Community to see what others are saying!
This article by Simply Wall St is general in nature. We provide commentary based on historical data and analyst forecasts only using an unbiased methodology and our articles are not intended to be financial advice. It does not constitute a recommendation to buy or sell any stock, and does not take account of your objectives, or your financial situation. We aim to bring you long-term focused analysis driven by fundamental data. Note that our analysis may not factor in the latest price-sensitive company announcements or qualitative material. Simply Wall St has no position in any stocks mentioned.
Have feedback on this article? Concerned about the content? Get in touch with us directly. Alternatively, email editorial-team@simplywallst.com