
 Nasdaq
 华尔街日报
华尔街日报Assessing Whether Karman Holdings (KRMN) Shares Look Overvalued After Recent Strong Price Momentum
Why Karman Holdings Is On Investors’ Radar
Karman Holdings (KRMN) has attracted fresh attention after a recent share price move, with the stock closing at $90.41. This has prompted investors to reassess how its current valuation aligns with its fundamentals.
See our latest analysis for Karman Holdings.
The recent 7.64% 1 day share price return and 38.14% 30 day share price return suggest momentum has been building, with the year to date share price return of 17.64% reinforcing that shift in sentiment around valuation and growth prospects.
If Karman has grabbed your attention, it can be useful to see what else is moving in similar areas of the market through aerospace and defense stocks.
With Karman’s recent run, current price of $90.41 and shares trading at a premium to the average analyst target of $83.29, you have to ask: is there real value left here, or is the market already pricing in future growth?
Price-to-Sales of 27.9x: Is It Justified?
Karman’s current P/S of 27.9x sits on top of a US$90.41 share price, while peers and fair value estimates point to very different levels.
The P/S ratio compares the company’s market value to its revenue, so a higher multiple usually reflects investors paying up for future growth and profitability expectations.
For Karman, the current 27.9x P/S is described as expensive versus the peer average of 7.5x and the US Aerospace & Defense industry average of 3.6x. This implies the market is pricing Karman’s sales at a far richer level than many listed competitors. Against an estimated fair P/S ratio of 5.8x, that premium looks even steeper. This suggests a level the market could potentially move towards if sentiment or assumptions around growth and margins change.
Explore the SWS fair ratio for Karman Holdings
Result: Price-to-Sales of 27.9x (OVERVALUED)
However, if revenue growth or net income of US$11.34m fall short of expectations, or sector sentiment cools, this premium P/S could quickly look vulnerable.
Find out about the key risks to this Karman Holdings narrative.
Another View: Our DCF Model Sends A Different Signal
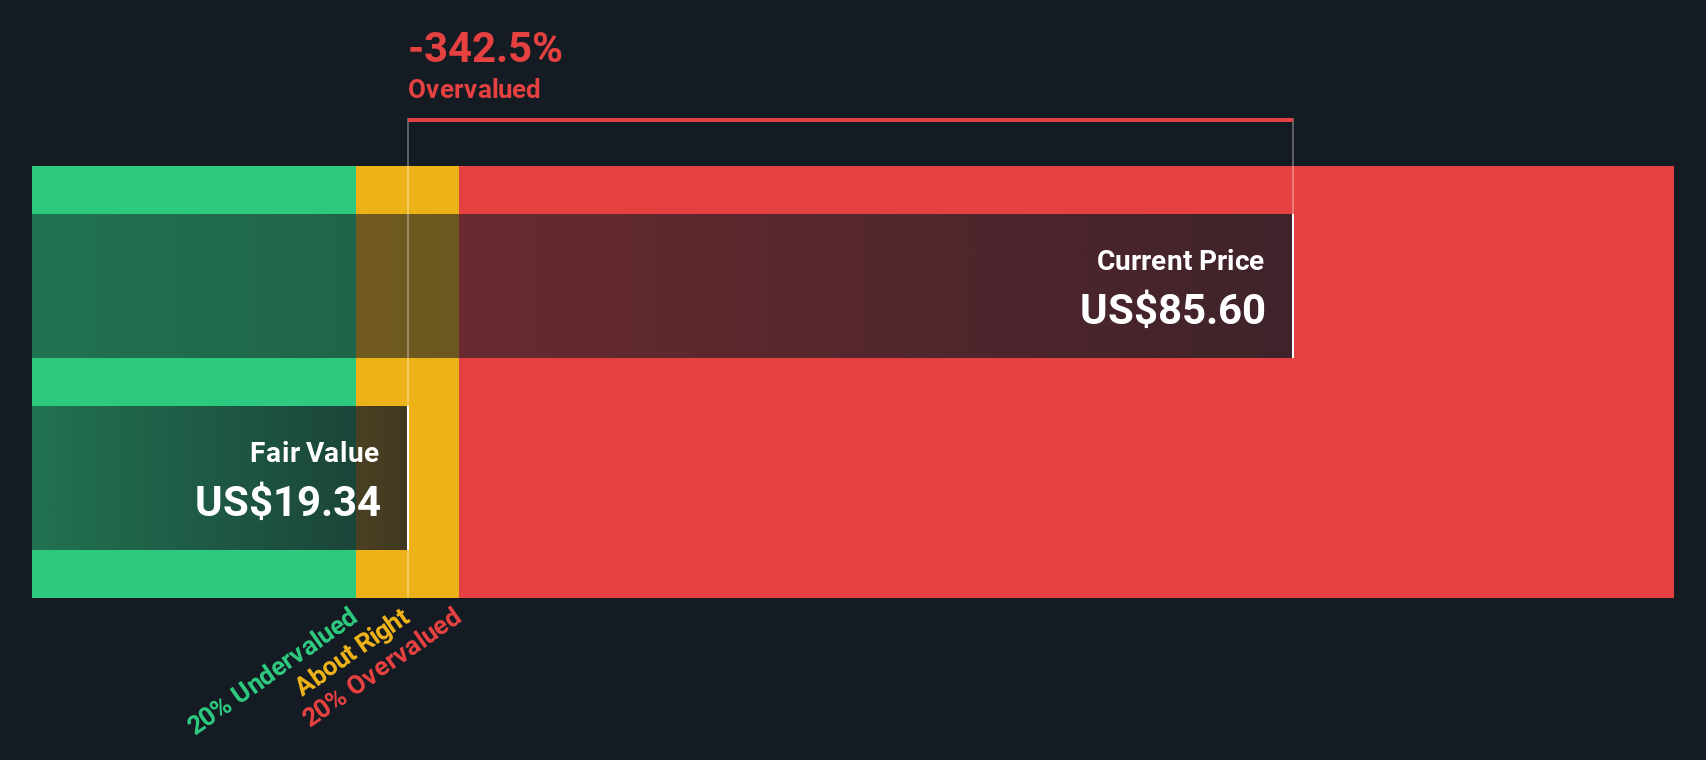
While the 27.9x P/S ratio presents Karman as expensive relative to peers and the industry, our DCF model suggests an even stronger case. On that view, the current US$90.41 share price stands well above an estimate of fair value at US$26.50, which indicates a wide gap between price and underlying cash flow assumptions. The key question is whether you think the future can fill that gap, or whether the price eventually has to.
Look into how the SWS DCF model arrives at its fair value.
Simply Wall St performs a discounted cash flow (DCF) on every stock in the world every day (check out Karman Holdings for example). We show the entire calculation in full. You can track the result in your watchlist or portfolio and be alerted when this changes, or use our stock screener to discover 875 undervalued stocks based on their cash flows. If you save a screener we even alert you when new companies match - so you never miss a potential opportunity.
Build Your Own Karman Holdings Narrative
If this view does not quite fit with your own, or you would rather test the assumptions yourself, you can build a full narrative in just a few minutes with Do it your way.
A great starting point for your Karman Holdings research is our analysis highlighting 2 key rewards and 3 important warning signs that could impact your investment decision.
Looking for more investment ideas?
If you are weighing up Karman today, do not stop there. Casting a wider net can help you spot opportunities you would otherwise miss.
- Spot potential high growth stories early by checking out these 3553 penny stocks with strong financials that already show stronger fundamentals than many expect from this corner of the market.
- Zero in on the intersection of medicine and algorithms with these 29 healthcare AI stocks, where companies are working on data driven tools for diagnostics and treatment.
- Lean into the long term income theme by reviewing these 11 dividend stocks with yields > 3%, focused on businesses offering yields above 3% that may appeal to cash flow focused investors.
This article by Simply Wall St is general in nature. We provide commentary based on historical data and analyst forecasts only using an unbiased methodology and our articles are not intended to be financial advice. It does not constitute a recommendation to buy or sell any stock, and does not take account of your objectives, or your financial situation. We aim to bring you long-term focused analysis driven by fundamental data. Note that our analysis may not factor in the latest price-sensitive company announcements or qualitative material. Simply Wall St has no position in any stocks mentioned.
Have feedback on this article? Concerned about the content? Get in touch with us directly. Alternatively, email editorial-team@simplywallst.com