
 Nasdaq
 华尔街日报
华尔街日报Is NiSource (NI) Priced Too Rich After Strong Multi Year Share Price Gains
- If you are wondering whether NiSource is offering fair value at around US$41.88 per share, this article will walk through what the current price really reflects.
- NiSource's share price has been relatively steady in the short term, with a 0.4% decline over the last 7 days and a 0.3% decline over 30 days, while the longer term picture shows a 20.4% return over 1 year, 68.0% over 3 years and 126.9% over 5 years.
- These returns sit against a backdrop of ongoing interest in regulated utilities. Investors often focus on stability, dividends and inflation protection, and NiSource continues to be part of that conversation. Broader sector sentiment, interest rate expectations and regulatory developments are all factors investors are watching closely as they assess whether the recent price level still makes sense.
- On our simple 6 point valuation checklist, NiSource scores a 1 out of 6. We will look at how different methods like DCFs, multiples and peer comparisons line up with the market price today, and then finish with a framework that can help you read those valuation signals in a more meaningful way.
NiSource scores just 1/6 on our valuation checks. See what other red flags we found in the full valuation breakdown.
Approach 1: NiSource Dividend Discount Model (DDM) Analysis
The Dividend Discount Model estimates what NiSource might be worth today by projecting future dividends and discounting them back to a present value. It is a straightforward way to ask whether the current yield and dividend growth look sustainable and attractive at today’s price.
For NiSource, the model uses a dividend per share of US$1.31, a return on equity of 9.12% and a payout ratio of about 61.60%. Dividend growth in the model is capped at 3.26%, with an expected growth input of 3.50%. These assumptions aim to keep the implied growth in line with what might be supported by earnings and reinvestment, rather than relying on aggressive forecasts.
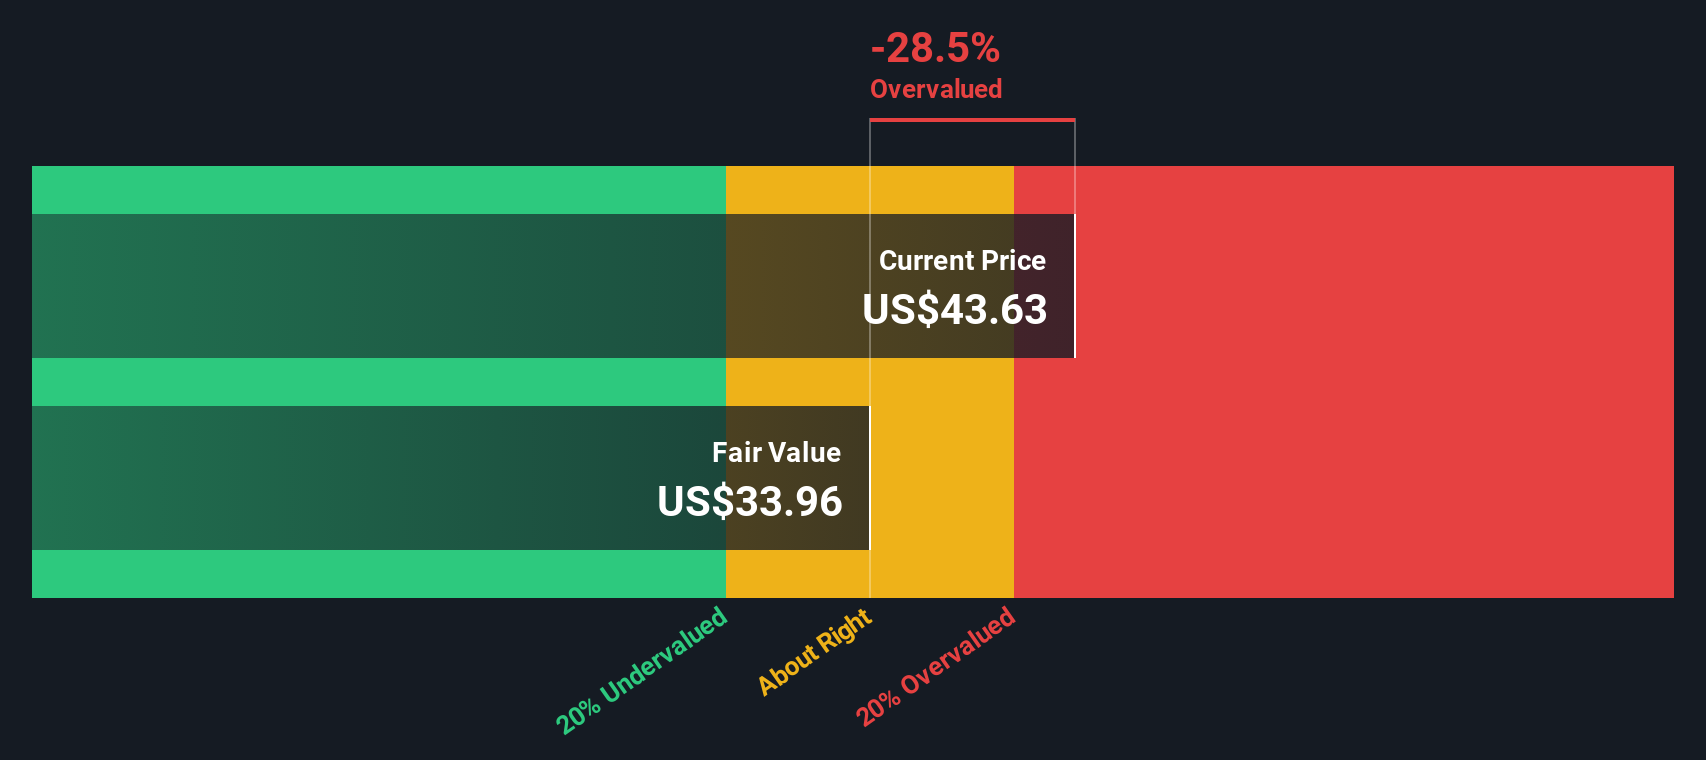
Putting those inputs together, the DDM produces an estimated intrinsic value of about US$35.46 per share. Against the recent share price of roughly US$41.88, this implies NiSource screens as around 18.1% overvalued on this dividend based approach.
Result: OVERVALUED
Our Dividend Discount Model (DDM) analysis suggests NiSource may be overvalued by 18.1%. Discover 874 undervalued stocks or create your own screener to find better value opportunities.
Approach 2: NiSource Price vs Earnings
For a profitable company like NiSource, the P/E ratio is a useful shorthand for how much investors are paying for each dollar of earnings. Higher growth potential and lower perceived risk usually justify a higher “normal” P/E, while slower growth or higher risk tend to point to a lower one.
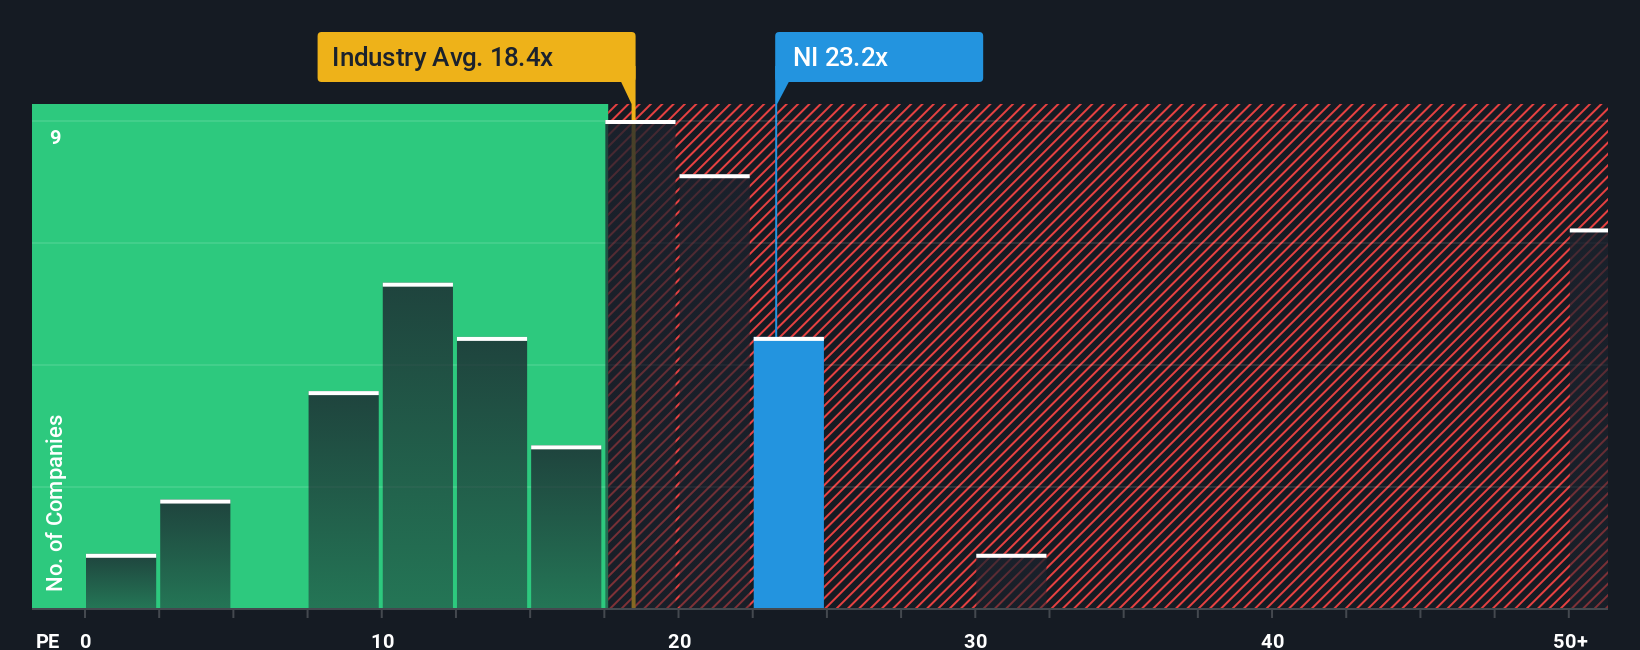
NiSource currently trades at about 22.37x earnings. That sits above the Integrated Utilities industry average P/E of 18.25x, but below the peer group average of 28.30x. Simply Wall St’s “Fair Ratio” for NiSource is 21.41x, which is the P/E level the model suggests could be reasonable given factors such as its earnings profile, industry, profit margins, market cap and company specific risks.
The Fair Ratio aims to be more tailored than a simple peer or industry comparison, because it adjusts for NiSource’s own growth expectations, risk characteristics and business mix rather than assuming it should trade exactly like the average utility. Comparing the current P/E of 22.37x with the Fair Ratio of 21.41x suggests NiSource screens as somewhat overvalued on this metric.
Result: OVERVALUED
P/E ratios tell one story, but what if the real opportunity lies elsewhere? Discover 1449 companies where insiders are betting big on explosive growth.
Upgrade Your Decision Making: Choose your NiSource Narrative
Earlier we mentioned that there is an even better way to understand valuation. Let us introduce you to Narratives, which are simply your story about NiSource. A Narrative links what you believe about its future revenue, earnings and margins to a forecast, a fair value and then a clear comparison with today’s price. All of this sits within an easy tool on Simply Wall St’s Community page that updates when news or earnings hit. For example, one NiSource Narrative might lean toward the higher fair value of about US$46.36 per share based on confidence in long term capital plans. Another might anchor closer to the lower analyst target of US$36.00 because it puts more weight on risks around gas exposure, regulation and capital intensity.
Do you think there's more to the story for NiSource? Head over to our Community to see what others are saying!

This article by Simply Wall St is general in nature. We provide commentary based on historical data and analyst forecasts only using an unbiased methodology and our articles are not intended to be financial advice. It does not constitute a recommendation to buy or sell any stock, and does not take account of your objectives, or your financial situation. We aim to bring you long-term focused analysis driven by fundamental data. Note that our analysis may not factor in the latest price-sensitive company announcements or qualitative material. Simply Wall St has no position in any stocks mentioned.
Have feedback on this article? Concerned about the content? Get in touch with us directly. Alternatively, email editorial-team@simplywallst.com