
 Nasdaq
 华尔街日报
华尔街日报Cmb.Tech (ENXTBR:CMBT) Valuation Check As Shares Trade Ex Dividend
Cmb.Tech (ENXTBR:CMBT) has moved into its ex dividend period after confirming a cash payout of US$0.05 per common share, drawing attention from investors tracking timing, yield and currency treatment.
See our latest analysis for Cmb.Tech.
The ex dividend announcement comes after a 4.66% 1 day share price return and a 4.02% 7 day share price return, set against a 10.77% 90 day share price return and a 1 year total shareholder return decline of 14.86%, suggesting recent momentum contrasts with a weaker longer term experience.
If this dividend has you reviewing your portfolio, it could be a good moment to broaden your search and check out fast growing stocks with high insider ownership.
With a recent share price of €8.54, a price target implying a discount of around 22% and an intrinsic discount indicator, the key question is whether Cmb.Tech is genuinely undervalued or if the market is already pricing in future growth.
Price-to-Earnings of 17.6x: Is it justified?
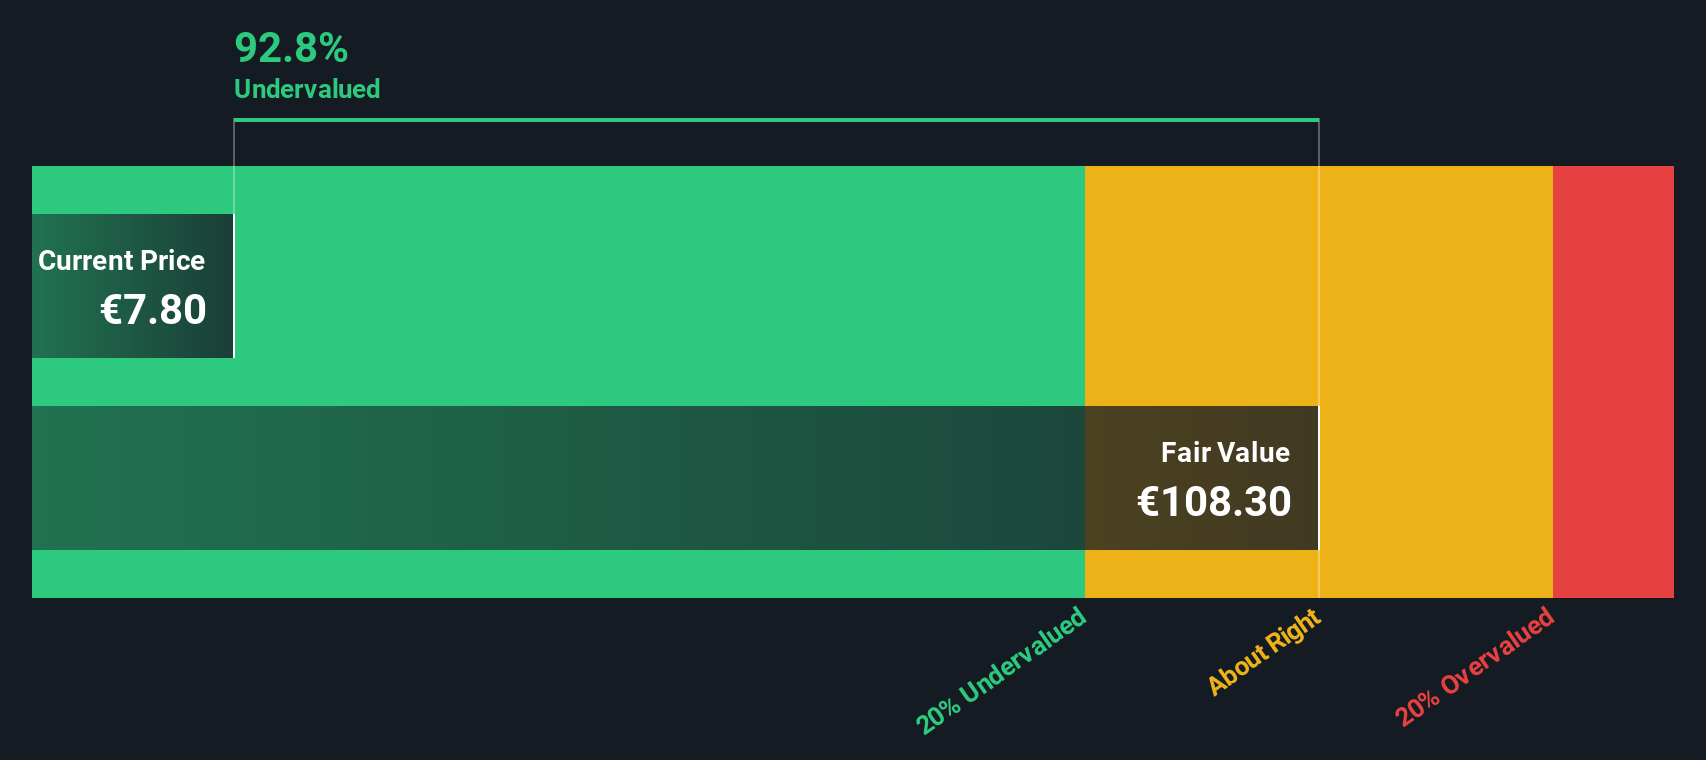
On a P/E of 17.6x against a last close of €8.54, Cmb.Tech screens as expensive compared with peers, even though our DCF model indicates a very large gap to its own fair value estimate.
The P/E ratio links the current share price to earnings per share, so a higher multiple often reflects the market paying more today for each unit of current earnings. For a company like Cmb.Tech, which operates across marine transport and hydrogen related activities, that figure can also hint at how much of the business mix investors see as higher growth or higher quality.
In this case, the 17.6x P/E is above both the peer group average of 15.2x and the wider European Oil and Gas industry average of 11.8x. This represents a clear premium. At the same time, our SWS DCF model estimates fair value at €131.62, which is very large compared with the current share price and suggests the market value and the cash flow based valuation are pointing in very different directions.
See what the numbers say about this price — find out in our valuation breakdown.
Result: Price-to-Earnings of 17.6x (OVERVALUED)
However, the 14.86% 1 year total return decline and the recent 8.47% 30 day pullback suggest sentiment could turn again if earnings or hydrogen projects disappoint.
Find out about the key risks to this Cmb.Tech narrative.
DCF Says The Opposite: Very Large Upside
While the 17.6x P/E hints at an expensive stock, our DCF model points in the other direction. It puts Cmb.Tech's fair value at €131.62 per share versus a market price of €8.54, implying a very large gap that suggests the shares could be trading at a steep discount.
This kind of disconnect between earnings based pricing and a cash flow model can signal either an opportunity or a warning that key assumptions may be off. It raises a simple question for you as an investor: is the market overly cautious, or is the DCF too optimistic about future cash generation?
Look into how the SWS DCF model arrives at its fair value.
Simply Wall St performs a discounted cash flow (DCF) on every stock in the world every day (check out Cmb.Tech for example). We show the entire calculation in full. You can track the result in your watchlist or portfolio and be alerted when this changes, or use our stock screener to discover 877 undervalued stocks based on their cash flows. If you save a screener we even alert you when new companies match - so you never miss a potential opportunity.
Build Your Own Cmb.Tech Narrative
If you see the numbers differently or simply prefer to rely on your own work, you can pull up the data, test your assumptions and build a custom story for Cmb.Tech in just a few minutes, then Do it your way.
A great starting point for your Cmb.Tech research is our analysis highlighting 2 key rewards and 6 important warning signs that could impact your investment decision.
Looking for more investment ideas?
If Cmb.Tech is on your radar, do not stop there. Use the same tools to spot other opportunities that could suit your style and risk level.
- Target potential mispricings by checking out these 877 undervalued stocks based on cash flows, where valuations and fundamentals line up more clearly.
- Tap into future focused trends through these 25 AI penny stocks and zero in on companies tied to artificial intelligence themes.
- Strengthen your income focus by scanning these 11 dividend stocks with yields > 3% to see which companies currently offer higher yields with supporting fundamentals.
This article by Simply Wall St is general in nature. We provide commentary based on historical data and analyst forecasts only using an unbiased methodology and our articles are not intended to be financial advice. It does not constitute a recommendation to buy or sell any stock, and does not take account of your objectives, or your financial situation. We aim to bring you long-term focused analysis driven by fundamental data. Note that our analysis may not factor in the latest price-sensitive company announcements or qualitative material. Simply Wall St has no position in any stocks mentioned.
Have feedback on this article? Concerned about the content? Get in touch with us directly. Alternatively, email editorial-team@simplywallst.com