
 Nasdaq
 华尔街日报
华尔街日报Is UnitedHealth Group (UNH) Attractive After A 30% One-Year Share Price Decline?
- If you have been wondering whether UnitedHealth Group's current share price reflects its underlying worth, you are not alone. This article is built to help you assess that question clearly.
- The stock last closed at US$348.97, with recent returns of 5.1% over 7 days, 5.5% over 30 days, 3.7% year to date, and a 30.5% decline over 1 year alongside a 24.2% decline over 3 years and a 5.9% gain over 5 years.
- Recent headlines around UnitedHealth Group have focused on regulatory attention on managed care companies and changing investor sentiment toward large healthcare insurers, which has influenced how investors think about risk in the sector. These developments provide useful context when weighing whether the current share price still aligns with long term expectations for the business.
- Our valuation checks give UnitedHealth Group a score of 5/6. Next we will look at what different valuation methods say about the stock today, before finishing with an approach that can help you put all those numbers in a broader context.
Find out why UnitedHealth Group's -30.5% return over the last year is lagging behind its peers.
Approach 1: UnitedHealth Group Discounted Cash Flow (DCF) Analysis
A Discounted Cash Flow, or DCF, model takes estimates of the cash a company could generate in the future and discounts those cash flows back to today to arrive at an estimated intrinsic value per share.
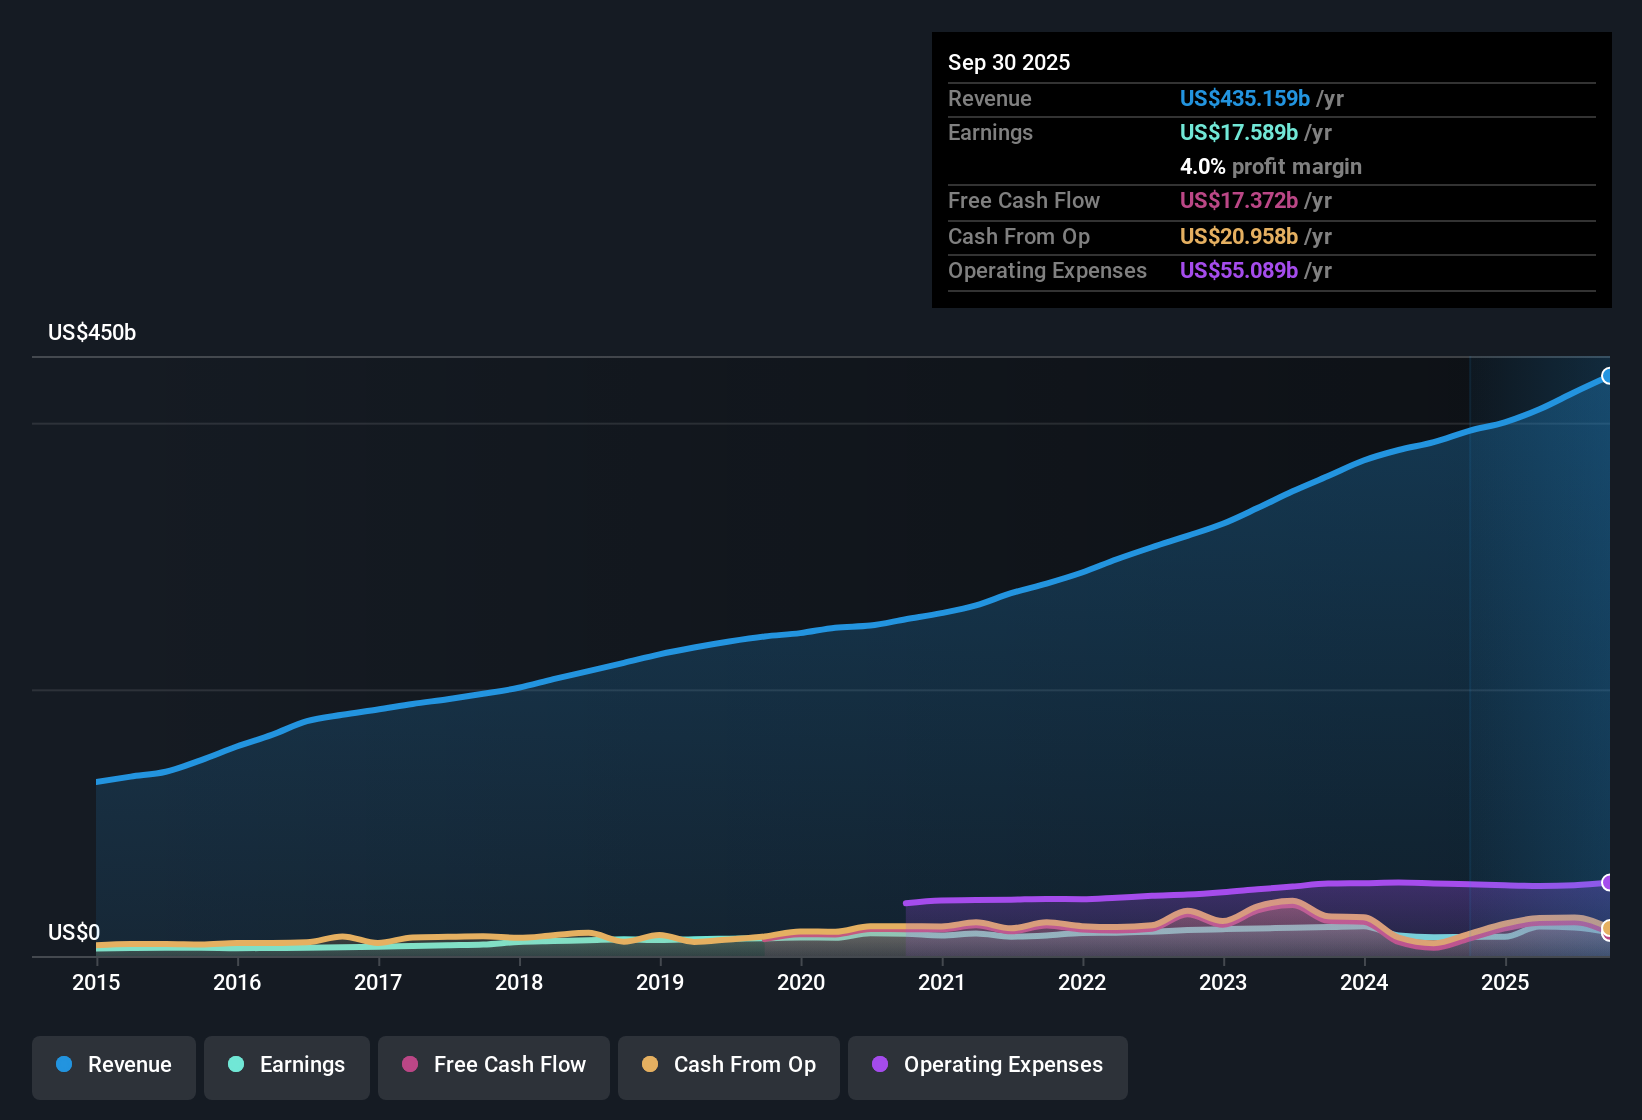
For UnitedHealth Group, the latest twelve month free cash flow is about $17.1b. Analyst and extrapolated projections used in this 2 Stage Free Cash Flow to Equity model point to free cash flow of $27.1b by 2029, with further estimates extending out to 2035. Simply Wall St uses analyst inputs where available, then extrapolates additional years to build a full 10 year cash flow path in dollars.
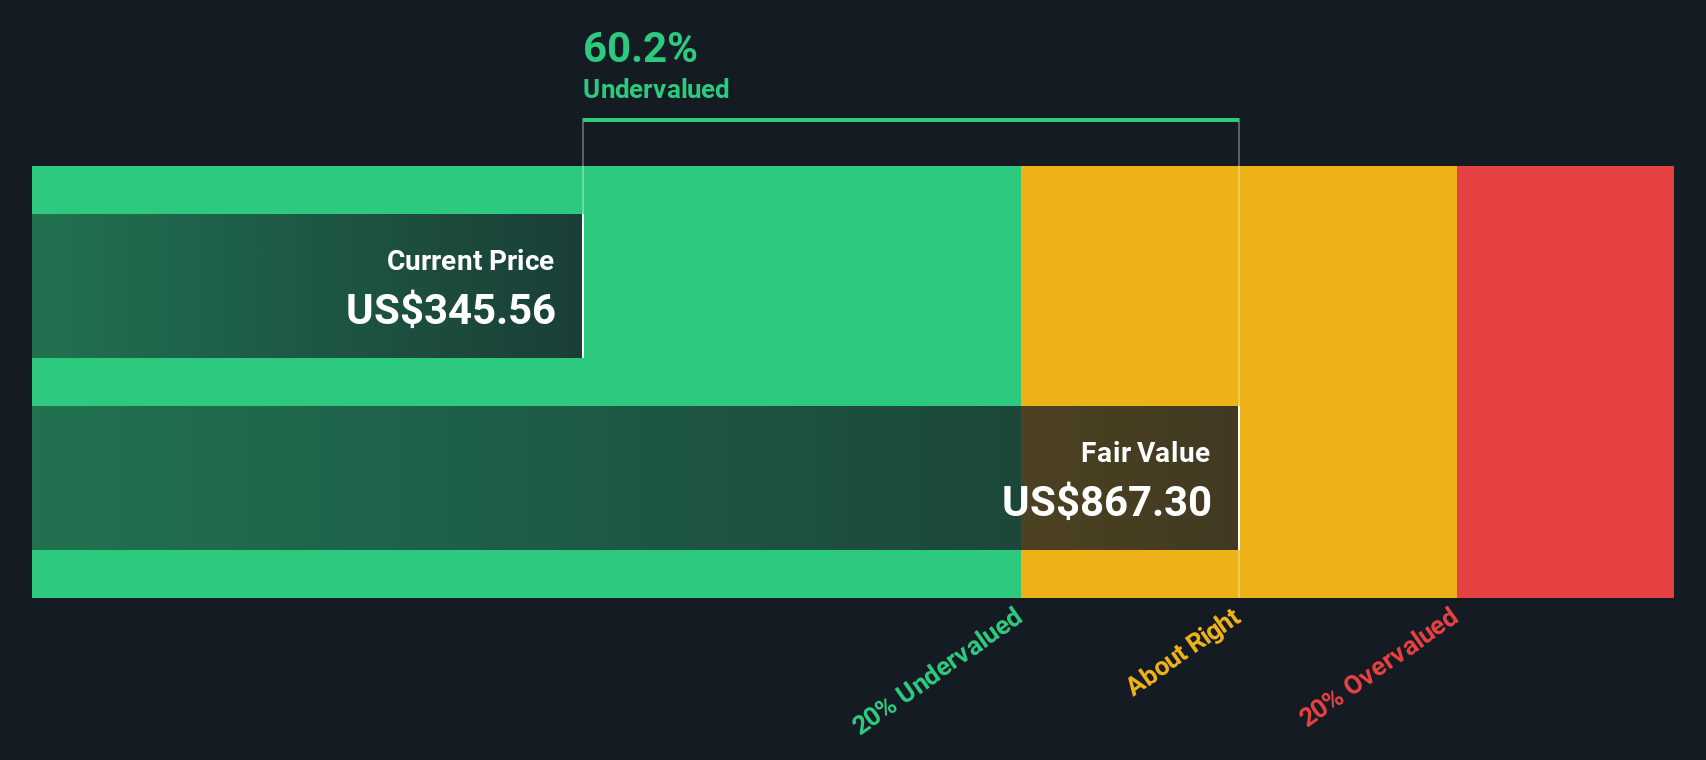
When those projected cash flows are discounted back and combined with a terminal value estimate, the model arrives at an intrinsic value of about $898.94 per share. Compared with the recent share price of $348.97, this particular DCF output suggests the stock trades at a 61.2% discount to that estimate. This indicates meaningful upside potential if the cash flow path and discount assumptions hold.
Result: UNDERVALUED
Our Discounted Cash Flow (DCF) analysis suggests UnitedHealth Group is undervalued by 61.2%. Track this in your watchlist or portfolio, or discover 877 more undervalued stocks based on cash flows.
Approach 2: UnitedHealth Group Price vs Earnings
For a profitable company like UnitedHealth Group, the P/E ratio is a useful way to relate what you pay for each share to the earnings that support it. It helps you see how much the market is currently willing to pay for one dollar of earnings.
What counts as a "normal" P/E depends a lot on expectations for future earnings growth and how risky those earnings are perceived to be. Higher expected growth or lower perceived risk often justify a higher P/E, while lower growth or higher uncertainty usually point to a lower multiple.
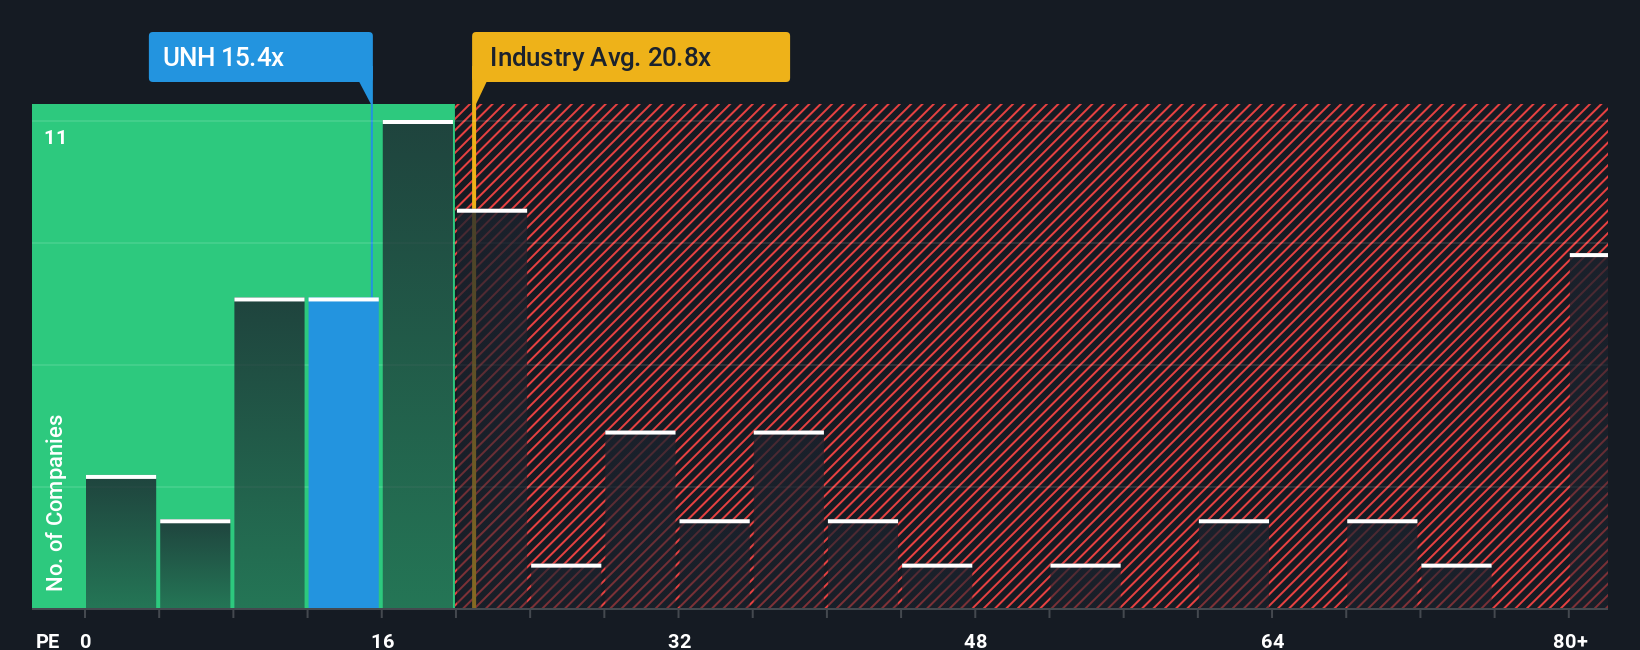
UnitedHealth Group currently trades on a P/E of 17.97x. That sits below the Healthcare industry average P/E of 23.25x and the peer average of 23.56x. Simply Wall St also calculates a proprietary Fair Ratio of 37.88x, which is the P/E it would expect for UnitedHealth Group given factors such as its earnings growth profile, industry, profit margins, market cap and risk characteristics.
The Fair Ratio is more tailored than a simple comparison with peers or the broad industry, because it adjusts for company specific traits rather than assuming all insurers or healthcare names deserve the same multiple. With the current P/E of 17.97x sitting well below the Fair Ratio of 37.88x, this framework points to the stock trading on a lower multiple than those fundamentals might suggest.
Result: UNDERVALUED
P/E ratios tell one story, but what if the real opportunity lies elsewhere? Discover 1449 companies where insiders are betting big on explosive growth.
Upgrade Your Decision Making: Choose your UnitedHealth Group Narrative
Earlier we mentioned that there is an even better way to understand valuation. Let us introduce you to Narratives, a simple way for you to put your own story about UnitedHealth Group into numbers by connecting what you believe about its future revenues, earnings and margins to a forecast and then to a fair value, all within the Simply Wall St Community page used by millions. Narratives update automatically as news or earnings arrive and can differ widely between investors. For example, one Narrative might lean closer to a fair value around the higher analyst target of US$626, while another might sit near the lower end around US$198. This gives you a clear, ongoing view of how your chosen fair value compares with the current price and helps you decide if the stock looks attractive, fairly priced or expensive based on your own assumptions rather than anyone else’s.
Do you think there's more to the story for UnitedHealth Group? Head over to our Community to see what others are saying!
This article by Simply Wall St is general in nature. We provide commentary based on historical data and analyst forecasts only using an unbiased methodology and our articles are not intended to be financial advice. It does not constitute a recommendation to buy or sell any stock, and does not take account of your objectives, or your financial situation. We aim to bring you long-term focused analysis driven by fundamental data. Note that our analysis may not factor in the latest price-sensitive company announcements or qualitative material. Simply Wall St has no position in any stocks mentioned.
Have feedback on this article? Concerned about the content? Get in touch with us directly. Alternatively, email editorial-team@simplywallst.com