
 Nasdaq
 华尔街日报
华尔街日报Is Ally Financial (ALLY) Still Attractive After Strong Multi‑Year Share Price Gains
- If you are wondering whether Ally Financial's share price offers enough value for the risk you are taking, this article walks through what the current valuation really implies.
- With the stock at US$47.06 and returns of 3.2% over 7 days, 11.0% over 30 days, 2.8% year to date, 35.9% over 1 year, 96.1% over 3 years and 43.9% over 5 years, many investors are asking whether the recent performance is already pricing in the key upsides and risks.
- Recent news around Ally Financial has centered on its position as a major US auto and consumer lender, as well as ongoing attention on credit quality and funding costs across the sector. These themes help frame how the market is thinking about Ally's earnings profile, risk and ultimately what investors are willing to pay for the stock.
- Right now Ally Financial scores 2 out of 6 on our valuation checks. This suggests some measures point to undervaluation while others look more balanced. We will walk through those methods next before finishing with a simple way to put all the valuation pieces together.
Ally Financial scores just 2/6 on our valuation checks. See what other red flags we found in the full valuation breakdown.
Approach 1: Ally Financial Excess Returns Analysis
The Excess Returns model looks at how much value Ally Financial can generate above the return that equity investors typically require. Instead of focusing on cash flows, it zeroes in on earnings power versus the cost of equity and how that compounds over time.
For Ally Financial, the model uses a Book Value of $41.56 per share and a Stable EPS of $5.63 per share, based on weighted future Return on Equity estimates from 9 analysts. The Average Return on Equity is 12.06%, compared with a Cost of Equity equivalent to $5.28 per share. That gap produces an Excess Return of $0.35 per share, suggesting the company is projected to earn slightly more on its equity base than investors are assumed to require. The Stable Book Value is $46.66 per share, sourced from weighted future Book Value estimates from 8 analysts.
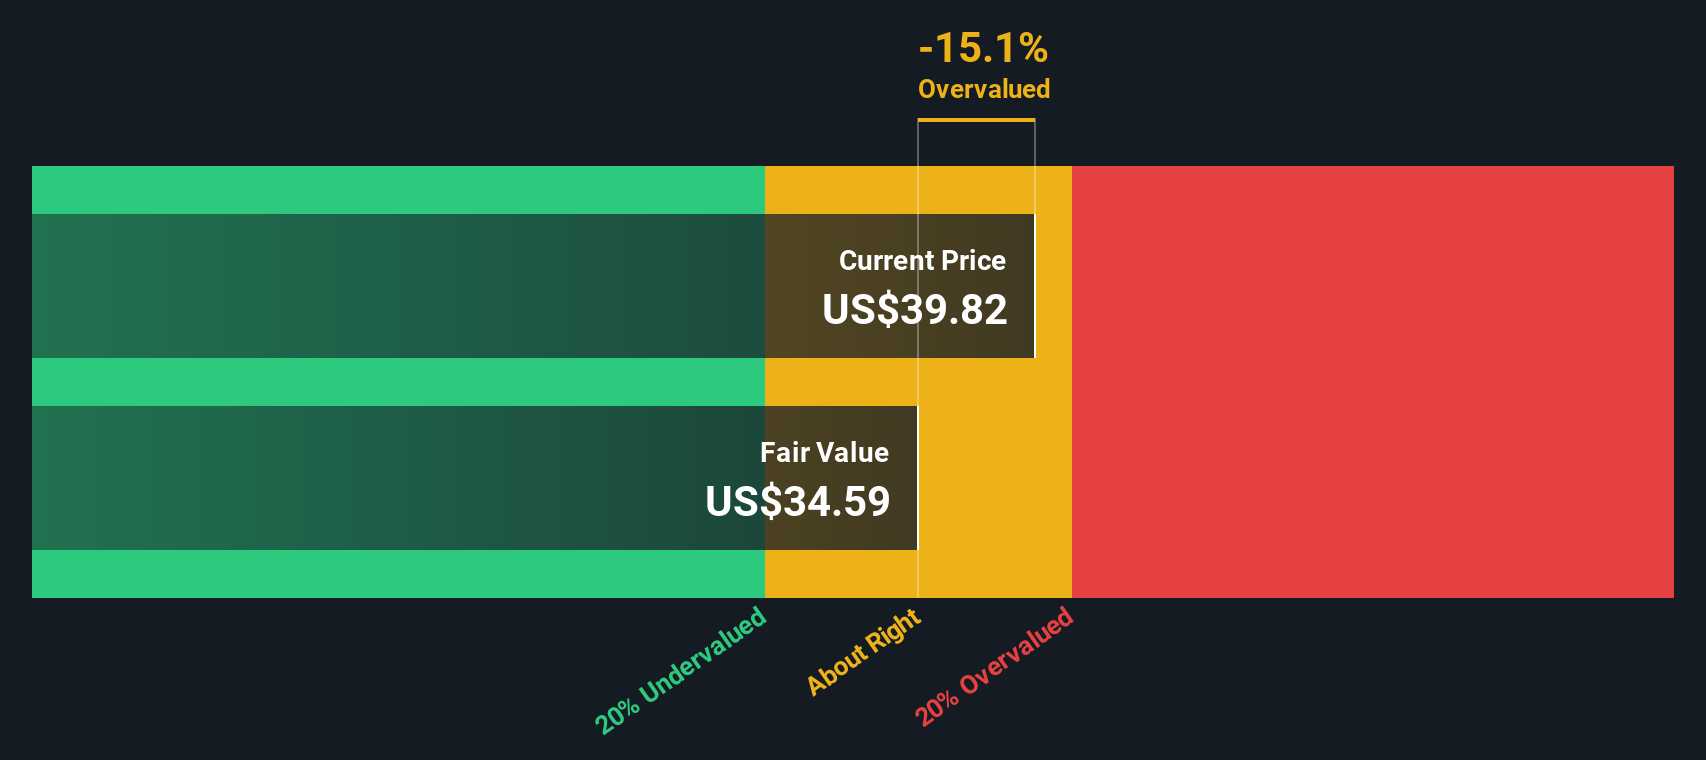
Putting this together, the Excess Returns model arrives at an intrinsic value of about $50.96 per share, compared with the current price of $47.06. That 7.6% intrinsic discount points to shares being close to fair value with a mild upside.
Result: ABOUT RIGHT
Ally Financial is fairly valued according to our Excess Returns, but this can change at a moment's notice. Track the value in your watchlist or portfolio and be alerted on when to act.
Approach 2: Ally Financial Price vs Earnings
P/E is a useful tool for a profitable lender like Ally Financial because it links what you pay directly to the earnings the business is currently generating. In general, higher growth expectations and lower perceived risk can justify a higher P/E ratio, while slower expected growth or higher risk tend to support a lower, more conservative multiple.
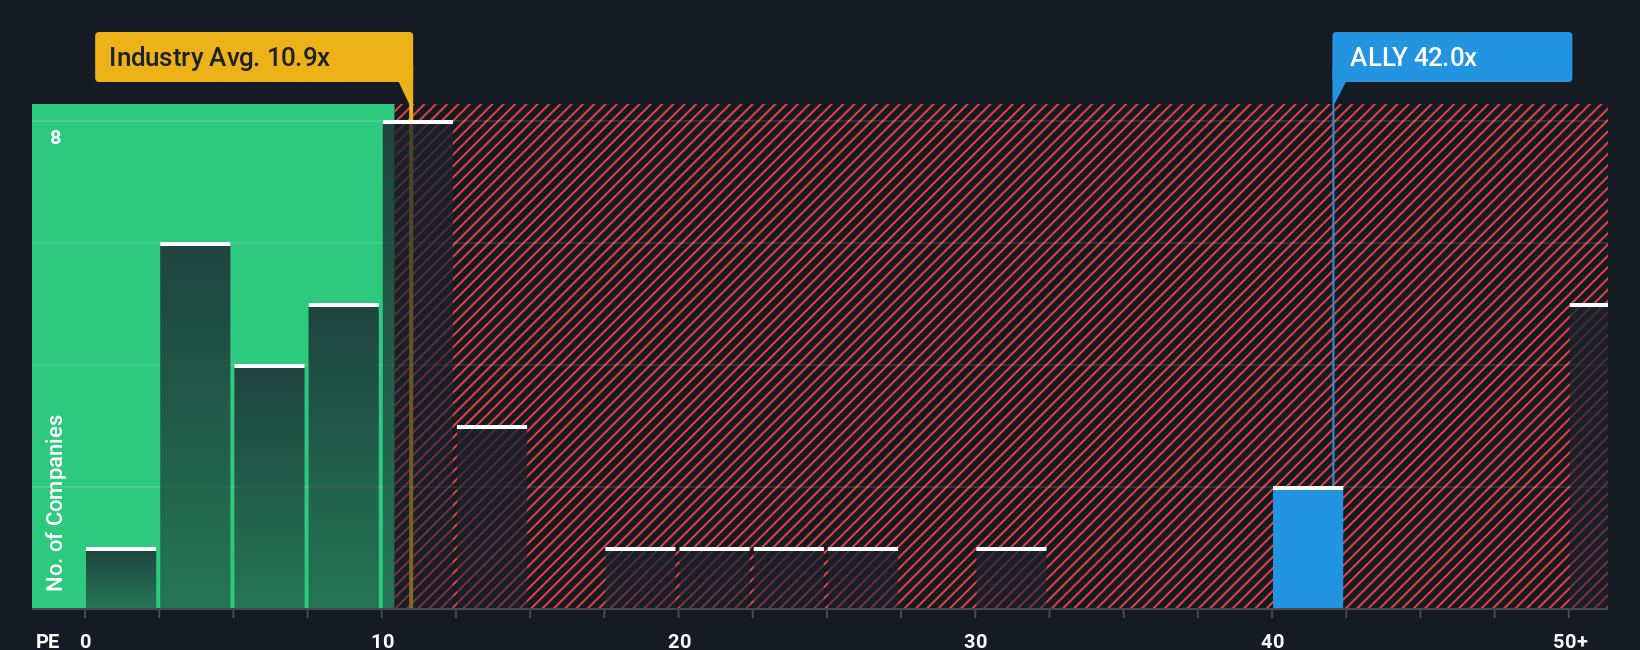
Right now, Ally Financial trades on a P/E of 27.67x. That is above the Consumer Finance industry average of 9.58x and below the peer group average of 60.40x. Simply Wall St’s Fair Ratio for Ally Financial is 20.52x. This is the P/E level it estimates would be reasonable given factors such as the company’s earnings profile, industry, profit margins, market cap and risk characteristics.
The Fair Ratio is designed to be more tailored than a simple comparison to peers or the broad industry, because it adjusts for company specific traits rather than assuming all lenders deserve the same multiple. Comparing Ally Financial’s actual P/E of 27.67x with the Fair Ratio of 20.52x indicates that the shares are trading on a richer multiple than that model would suggest.
Result: OVERVALUED
P/E ratios tell one story, but what if the real opportunity lies elsewhere? Discover 1449 companies where insiders are betting big on explosive growth.
Upgrade Your Decision Making: Choose your Ally Financial Narrative
Earlier we mentioned that there is an even better way to understand valuation. Narratives let you connect your view of Ally Financial’s story to a simple forecast and a Fair Value, all inside Simply Wall St’s Community page. You can say, for example, “I think Ally’s focus on digital banking, high quality auto lending and insurance can support analysts’ assumptions for revenue of about US$9.6b, earnings of roughly US$1.8b and a future P/E of around 11.4x.” Another investor might focus more on the risks around auto reliance, competition and regulation and lean closer to the lower US$39.00 price target. Once you set up that story, the platform continuously refreshes your Narrative when new news or earnings arrive and shows you, at a glance, how your Fair Value compares with the current share price. This can help you decide whether the stock looks closer to a buy, a hold or a sell for your own approach.
Do you think there's more to the story for Ally Financial? Head over to our Community to see what others are saying!

This article by Simply Wall St is general in nature. We provide commentary based on historical data and analyst forecasts only using an unbiased methodology and our articles are not intended to be financial advice. It does not constitute a recommendation to buy or sell any stock, and does not take account of your objectives, or your financial situation. We aim to bring you long-term focused analysis driven by fundamental data. Note that our analysis may not factor in the latest price-sensitive company announcements or qualitative material. Simply Wall St has no position in any stocks mentioned.
Have feedback on this article? Concerned about the content? Get in touch with us directly. Alternatively, email editorial-team@simplywallst.com