
 Nasdaq
 华尔街日报
华尔街日报Is Lyft (LYFT) Pricing Look Attractive After Recent Share Price Pullback?
- If you are wondering whether Lyft's share price still lines up with the underlying business, it helps to step back and look at what the current market is really paying for.
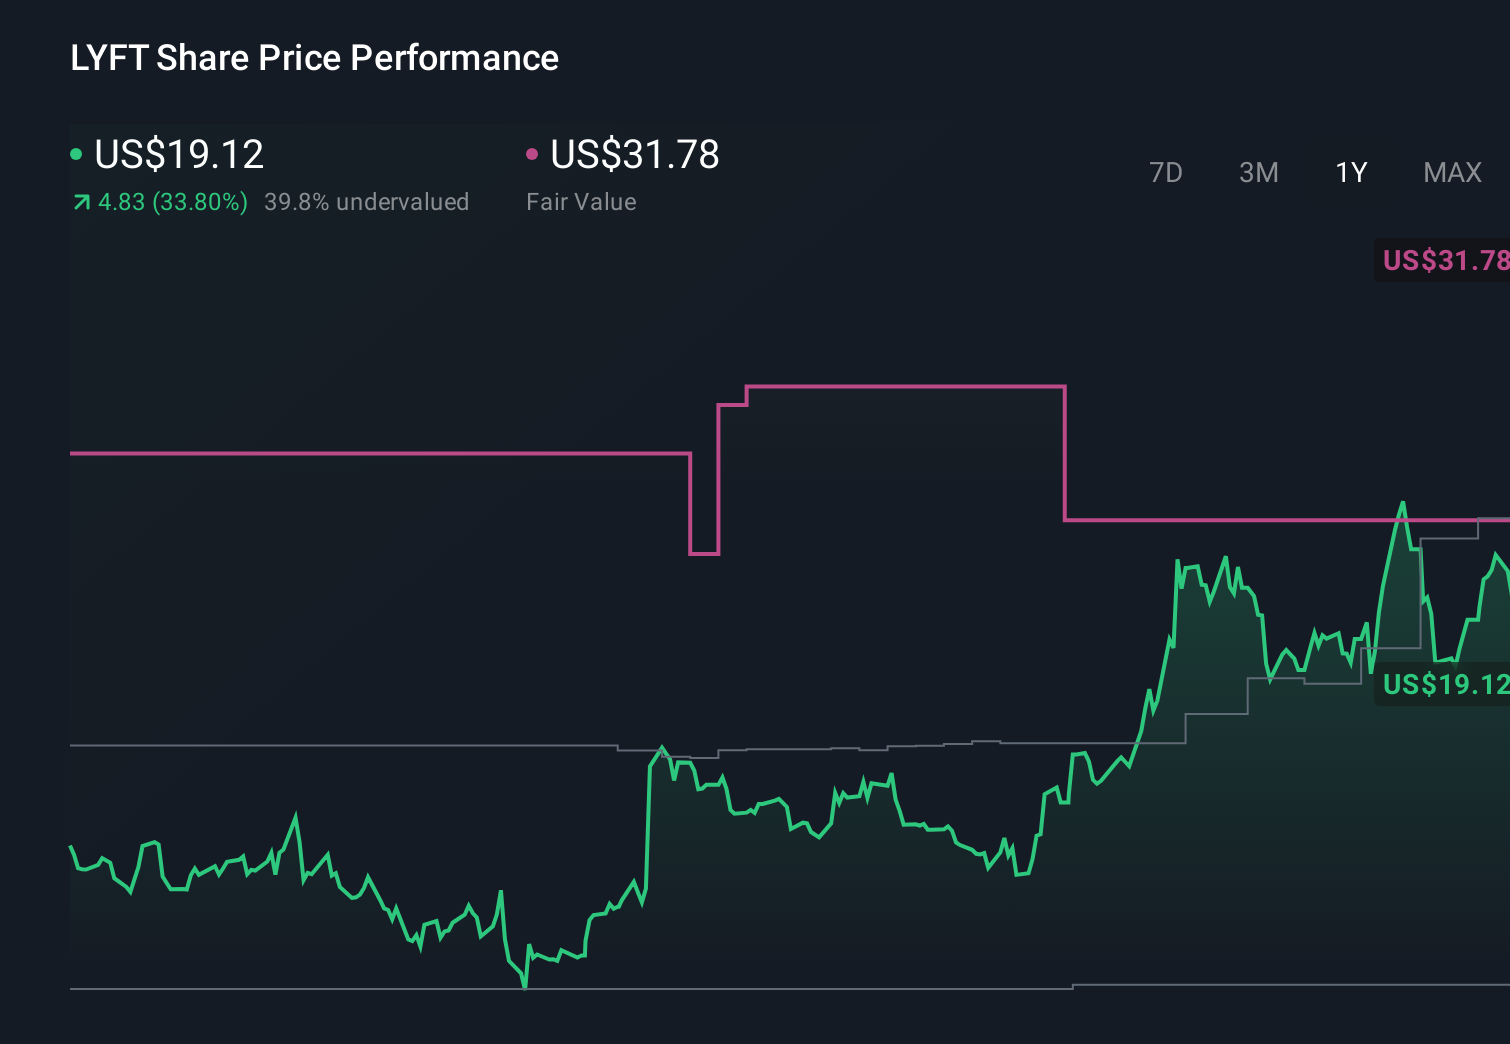
- At a last close of US$19.15, the stock is down 0.8% over the past week and 16.6% over the past month, while still showing a 33.7% return over 1 year and 43.9% over 3 years, compared to a 62.2% decline over 5 years.
- Recent coverage has focused on how Lyft is positioned within the ride hailing space and how investors are weighing its growth ambitions against the long term share price record. That context matters because it shapes whether the recent pullback looks like a reset in expectations or a pause after a stronger run over the past few years.
- On our valuation checks, Lyft scores 3 out of 6. You can see this in more detail in its valuation score. Next we will walk through the key valuation methods behind that number before finishing with a way to look at value that goes beyond simple multiples and models.
Approach 1: Lyft Discounted Cash Flow (DCF) Analysis
A Discounted Cash Flow, or DCF, model estimates what a business could be worth by projecting its future cash flows and then discounting those back to today’s dollars. It is essentially asking what all of Lyft’s future cash generation might be worth right now.
For Lyft, the model used is a 2 Stage Free Cash Flow to Equity approach, based on cash flow projections in US$. The latest twelve month free cash flow is about $958.6 million. Analyst inputs cover the nearer years and Simply Wall St extrapolates further out, with projected free cash flows running through to 2035, such as $1,111.9 million in 2026 and $1,297.5 million in 2028, then continuing with modelled estimates through year 10.
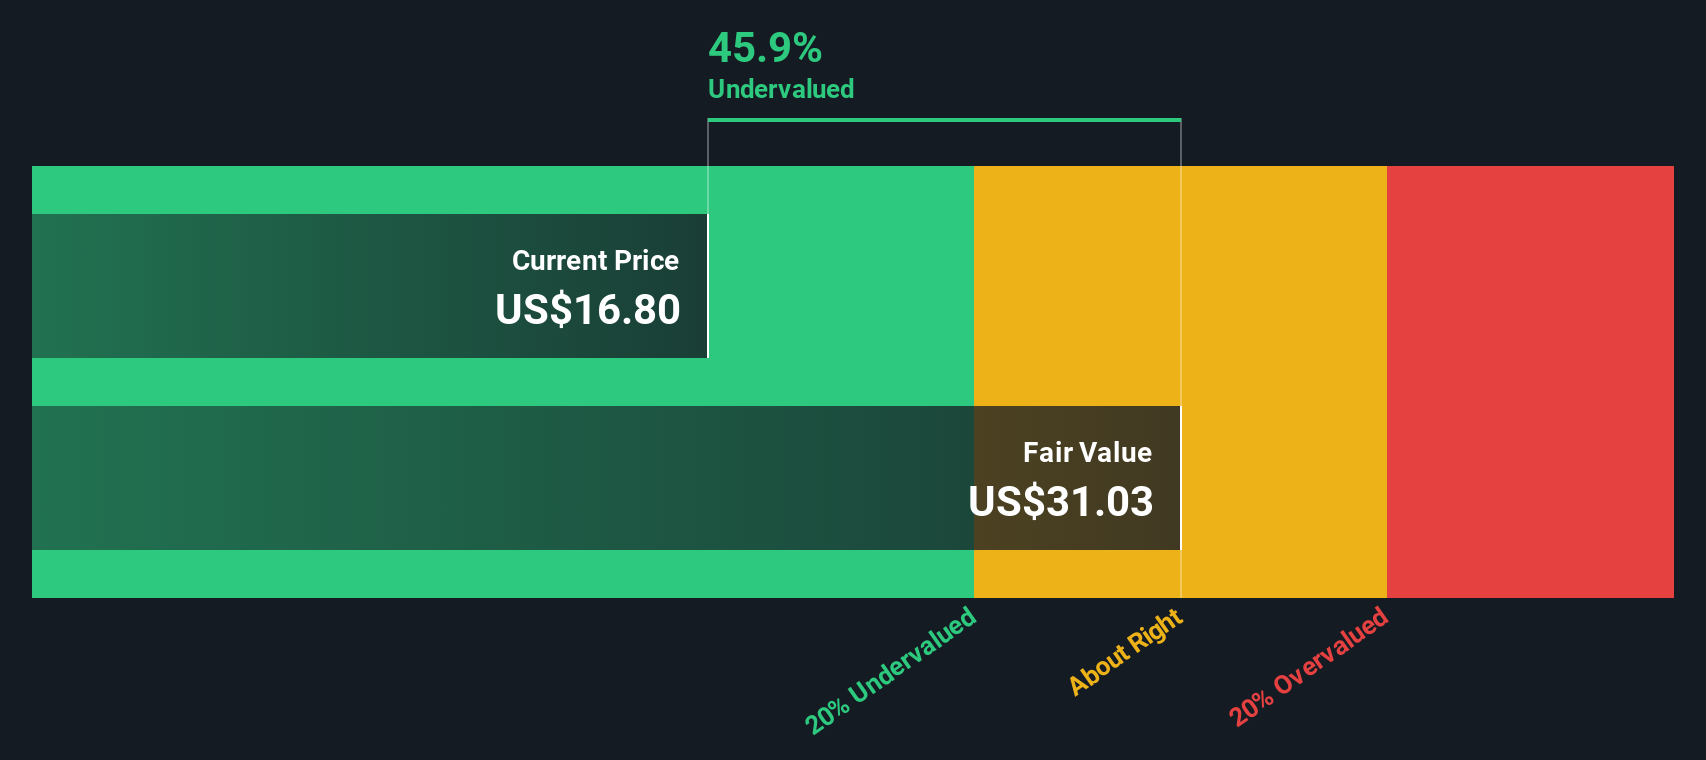
When those future cash flows are discounted back, the DCF model arrives at an estimated intrinsic value of about $55.74 per share. Compared to the recent share price of $19.15, this suggests Lyft is trading at a 65.6% discount to that intrinsic value, based on this model alone.
Result: UNDERVALUED
Our Discounted Cash Flow (DCF) analysis suggests Lyft is undervalued by 65.6%. Track this in your watchlist or portfolio, or discover 881 more undervalued stocks based on cash flows.
Approach 2: Lyft Price vs Earnings
For profitable companies, the P/E ratio is a useful way to connect what you pay for each share with the earnings that support it. It helps you see how many dollars of share price the market is assigning to each dollar of earnings.
What counts as a “normal” P/E depends on how investors see growth potential and risk. Higher expected growth or lower perceived risk can support a higher P/E, while slower growth or higher risk usually lines up with a lower P/E.
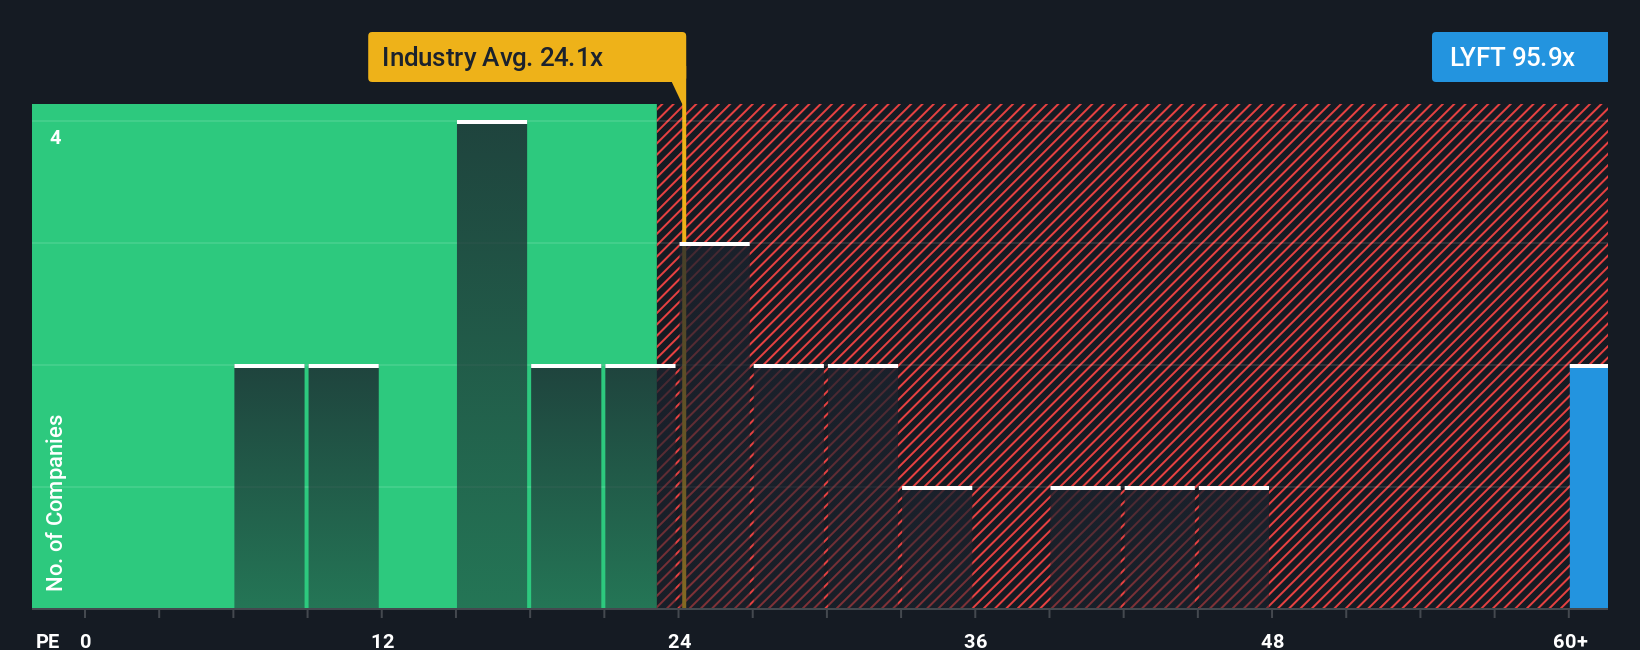
Lyft currently trades on a P/E of 50.75x. That sits above the Transportation industry average of 32.39x and below the peer average of 57.20x. Simply Wall St also calculates a “Fair Ratio” of 18.39x for Lyft, which is the P/E level suggested by factors such as its earnings growth profile, industry, profit margins, market cap and risk characteristics.
This Fair Ratio is more tailored than a simple comparison with peers or the industry, because it adjusts for company specific traits rather than assuming all businesses in the group should trade on the same multiple. Comparing Lyft’s current 50.75x P/E with the 18.39x Fair Ratio points to the shares trading above that modelled fair level.
Result: OVERVALUED
P/E ratios tell one story, but what if the real opportunity lies elsewhere? Discover 1450 companies where insiders are betting big on explosive growth.
Upgrade Your Decision Making: Choose your Lyft Narrative
Earlier we mentioned that there is an even better way to understand valuation, and on Simply Wall St this comes through Narratives. You connect your view of Lyft’s story to your own forecast for revenue, earnings and margins, turn that into a fair value, and then compare that fair value with the current price on the Community page. Narratives update as news or earnings arrive. For example, one Lyft Narrative might lean on the higher analyst expectations and a fair value around US$28, while a more cautious user could anchor on the lower end near US$10. This gives you a clear, numbers backed way to see which story you think is more reasonable and how that lines up with your own decision to buy, hold or sell.
Do you think there's more to the story for Lyft? Head over to our Community to see what others are saying!
This article by Simply Wall St is general in nature. We provide commentary based on historical data and analyst forecasts only using an unbiased methodology and our articles are not intended to be financial advice. It does not constitute a recommendation to buy or sell any stock, and does not take account of your objectives, or your financial situation. We aim to bring you long-term focused analysis driven by fundamental data. Note that our analysis may not factor in the latest price-sensitive company announcements or qualitative material. Simply Wall St has no position in any stocks mentioned.
Have feedback on this article? Concerned about the content? Get in touch with us directly. Alternatively, email editorial-team@simplywallst.com