
 Nasdaq
 华尔街日报
华尔街日报A Look At QXO (QXO) Valuation After US$1.2b Apollo Led Convertible Preferred Investment
QXO (QXO) has secured a private placement of up to US$1.145 billion in Series C convertible perpetual preferred stock, led by Apollo affiliates and Franklin Advisers, to fund acquisition-focused expansion within a defined timeframe.
See our latest analysis for QXO.
The Apollo led preferred equity announcement has gone hand in hand with a sharp move in the shares, with QXO’s latest share price at $23.30 and a 1 day share price return of 18.15%. Over the past year, investors have seen a 46.73% total shareholder return, while the 90 day share price return of 17.09% suggests momentum has recently been building as the market reacts to the company’s acquisition driven plans.
If this kind of deal making story has your attention, it can be useful to see what else is moving and compare QXO with fast growing stocks with high insider ownership.
With QXO reporting US$4,662.9m of revenue, a net loss of US$278.9m and a recent close of US$23.30, plus a reported intrinsic discount of about 51%, you have to ask: is there still a buying opportunity here, or is the market already pricing in future growth?
Price-to-Sales of 3.4x: Is it justified?
On a P/S of 3.4x and a last close of $23.30, QXO screens as inexpensive against its own estimated fair ratio, even though it sits well above its industry average.
P/S compares a company’s market value with its revenue and is often used when a business is still loss making, like QXO with its current net loss of US$278.9m against US$4,662.9m of revenue.
Against peers, QXO’s P/S of 3.4x matches the peer average of 3.4x. This points to a market view that is broadly in line with similar companies on sales alone. However, the SWS fair P/S ratio is 5.2x, a much higher level that signals investors may be pricing QXO below where sales based regression analysis suggests the multiple could settle if the company delivers on its plans.
Explore the SWS fair ratio for QXO
Result: Price-to-Sales of 3.4x (UNDERVALUED)
However, the story can change quickly if acquisition execution disappoints or if the business continues to run at a net loss of US$278.9m on US$4,662.9m of revenue.
Find out about the key risks to this QXO narrative.
Another view from our DCF model
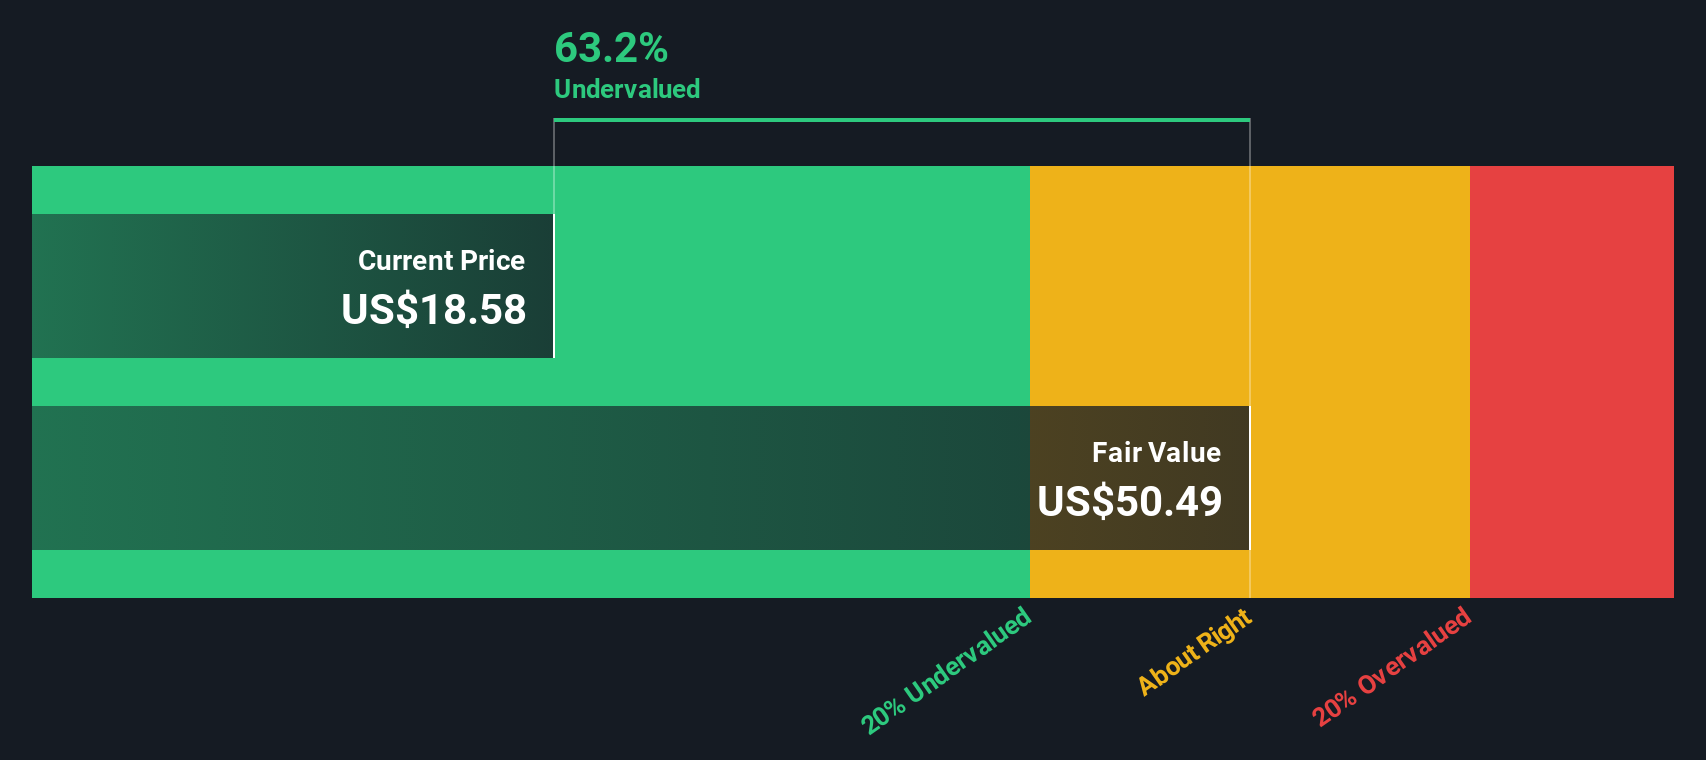
Our DCF model provides a similar perspective to the P/S work. With QXO at US$23.30 compared to an internal fair value estimate of US$47.77, the shares appear undervalued on cash flows as well. The question is whether the business can deliver the performance those cash flows imply.
Look into how the SWS DCF model arrives at its fair value.
Simply Wall St performs a discounted cash flow (DCF) on every stock in the world every day (check out QXO for example). We show the entire calculation in full. You can track the result in your watchlist or portfolio and be alerted when this changes, or use our stock screener to discover 883 undervalued stocks based on their cash flows. If you save a screener we even alert you when new companies match - so you never miss a potential opportunity.
Build Your Own QXO Narrative
If you see the numbers differently or prefer to test your own assumptions, you can build a personalised QXO view in just a few minutes with Do it your way.
A great starting point for your QXO research is our analysis highlighting 2 key rewards and 1 important warning sign that could impact your investment decision.
Looking for more investment ideas?
If you are serious about building a watchlist that suits your style, do not stop at QXO. Use the Screener to uncover what else might be worth attention.
- Target potential mispricing by checking out these 883 undervalued stocks based on cash flows that line up current prices with underlying cash flow strength.
- Spot emerging AI themes early by scanning these 25 AI penny stocks that are tied to real business models rather than just hype.
- Review income focused opportunities by examining these 14 dividend stocks with yields > 3% that offer yields above 3% with clearly disclosed fundamentals.
This article by Simply Wall St is general in nature. We provide commentary based on historical data and analyst forecasts only using an unbiased methodology and our articles are not intended to be financial advice. It does not constitute a recommendation to buy or sell any stock, and does not take account of your objectives, or your financial situation. We aim to bring you long-term focused analysis driven by fundamental data. Note that our analysis may not factor in the latest price-sensitive company announcements or qualitative material. Simply Wall St has no position in any stocks mentioned.
Have feedback on this article? Concerned about the content? Get in touch with us directly. Alternatively, email editorial-team@simplywallst.com