
 Nasdaq
 华尔街日报
华尔街日报Institutional investors are Okasan Securities Group Inc.'s (TSE:8609) biggest bettors and were rewarded after last week's JP¥8.6b market cap gain
Key Insights
- Institutions' substantial holdings in Okasan Securities Group implies that they have significant influence over the company's share price
- 51% of the business is held by the top 16 shareholders
- Using data from company's past performance alongside ownership research, one can better assess the future performance of a company
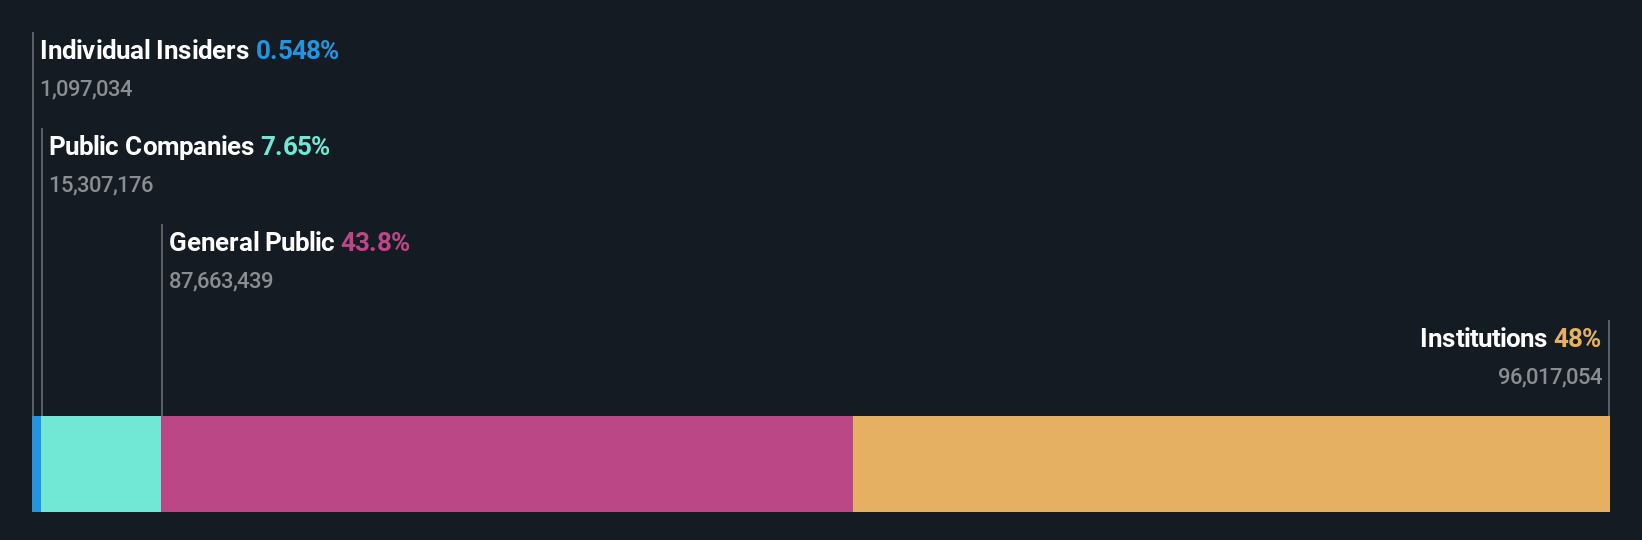
A look at the shareholders of Okasan Securities Group Inc. (TSE:8609) can tell us which group is most powerful. And the group that holds the biggest piece of the pie are institutions with 48% ownership. Put another way, the group faces the maximum upside potential (or downside risk).
And last week, institutional investors ended up benefitting the most after the company hit JP¥159b in market cap. The one-year return on investment is currently 30% and last week's gain would have been more than welcomed.
Let's take a closer look to see what the different types of shareholders can tell us about Okasan Securities Group.
See our latest analysis for Okasan Securities Group
What Does The Institutional Ownership Tell Us About Okasan Securities Group?
Many institutions measure their performance against an index that approximates the local market. So they usually pay more attention to companies that are included in major indices.
We can see that Okasan Securities Group does have institutional investors; and they hold a good portion of the company's stock. This suggests some credibility amongst professional investors. But we can't rely on that fact alone since institutions make bad investments sometimes, just like everyone does. When multiple institutions own a stock, there's always a risk that they are in a 'crowded trade'. When such a trade goes wrong, multiple parties may compete to sell stock fast. This risk is higher in a company without a history of growth. You can see Okasan Securities Group's historic earnings and revenue below, but keep in mind there's always more to the story.

We note that hedge funds don't have a meaningful investment in Okasan Securities Group. Looking at our data, we can see that the largest shareholder is Sumitomo Mitsui Trust Asset Management Co., Ltd. with 6.3% of shares outstanding. In comparison, the second and third largest shareholders hold about 5.0% and 4.9% of the stock.
A closer look at our ownership figures suggests that the top 16 shareholders have a combined ownership of 51% implying that no single shareholder has a majority.
Researching institutional ownership is a good way to gauge and filter a stock's expected performance. The same can be achieved by studying analyst sentiments. There is a little analyst coverage of the stock, but not much. So there is room for it to gain more coverage.
Insider Ownership Of Okasan Securities Group
While the precise definition of an insider can be subjective, almost everyone considers board members to be insiders. Management ultimately answers to the board. However, it is not uncommon for managers to be executive board members, especially if they are a founder or the CEO.
I generally consider insider ownership to be a good thing. However, on some occasions it makes it more difficult for other shareholders to hold the board accountable for decisions.
Our data suggests that insiders own under 1% of Okasan Securities Group Inc. in their own names. It is a pretty big company, so it would be possible for board members to own a meaningful interest in the company, without owning much of a proportional interest. In this case, they own around JP¥872m worth of shares (at current prices). It is good to see board members owning shares, but it might be worth checking if those insiders have been buying.
General Public Ownership
The general public, who are usually individual investors, hold a 44% stake in Okasan Securities Group. While this size of ownership may not be enough to sway a policy decision in their favour, they can still make a collective impact on company policies.
Public Company Ownership
It appears to us that public companies own 7.7% of Okasan Securities Group. This may be a strategic interest and the two companies may have related business interests. It could be that they have de-merged. This holding is probably worth investigating further.
Next Steps:
I find it very interesting to look at who exactly owns a company. But to truly gain insight, we need to consider other information, too. For instance, we've identified 2 warning signs for Okasan Securities Group (1 shouldn't be ignored) that you should be aware of.
But ultimately it is the future, not the past, that will determine how well the owners of this business will do. Therefore we think it advisable to take a look at this free report showing whether analysts are predicting a brighter future.
NB: Figures in this article are calculated using data from the last twelve months, which refer to the 12-month period ending on the last date of the month the financial statement is dated. This may not be consistent with full year annual report figures.
Have feedback on this article? Concerned about the content? Get in touch with us directly. Alternatively, email editorial-team (at) simplywallst.com.
This article by Simply Wall St is general in nature. We provide commentary based on historical data and analyst forecasts only using an unbiased methodology and our articles are not intended to be financial advice. It does not constitute a recommendation to buy or sell any stock, and does not take account of your objectives, or your financial situation. We aim to bring you long-term focused analysis driven by fundamental data. Note that our analysis may not factor in the latest price-sensitive company announcements or qualitative material. Simply Wall St has no position in any stocks mentioned.