
 Nasdaq
 华尔街日报
华尔街日报Is Booz Allen Hamilton (BAH) Offering Value After A 29% One Year Share Price Decline
- If you are wondering whether Booz Allen Hamilton Holding's share price reflects its underlying value, you are not alone. This article focuses on exactly that question.
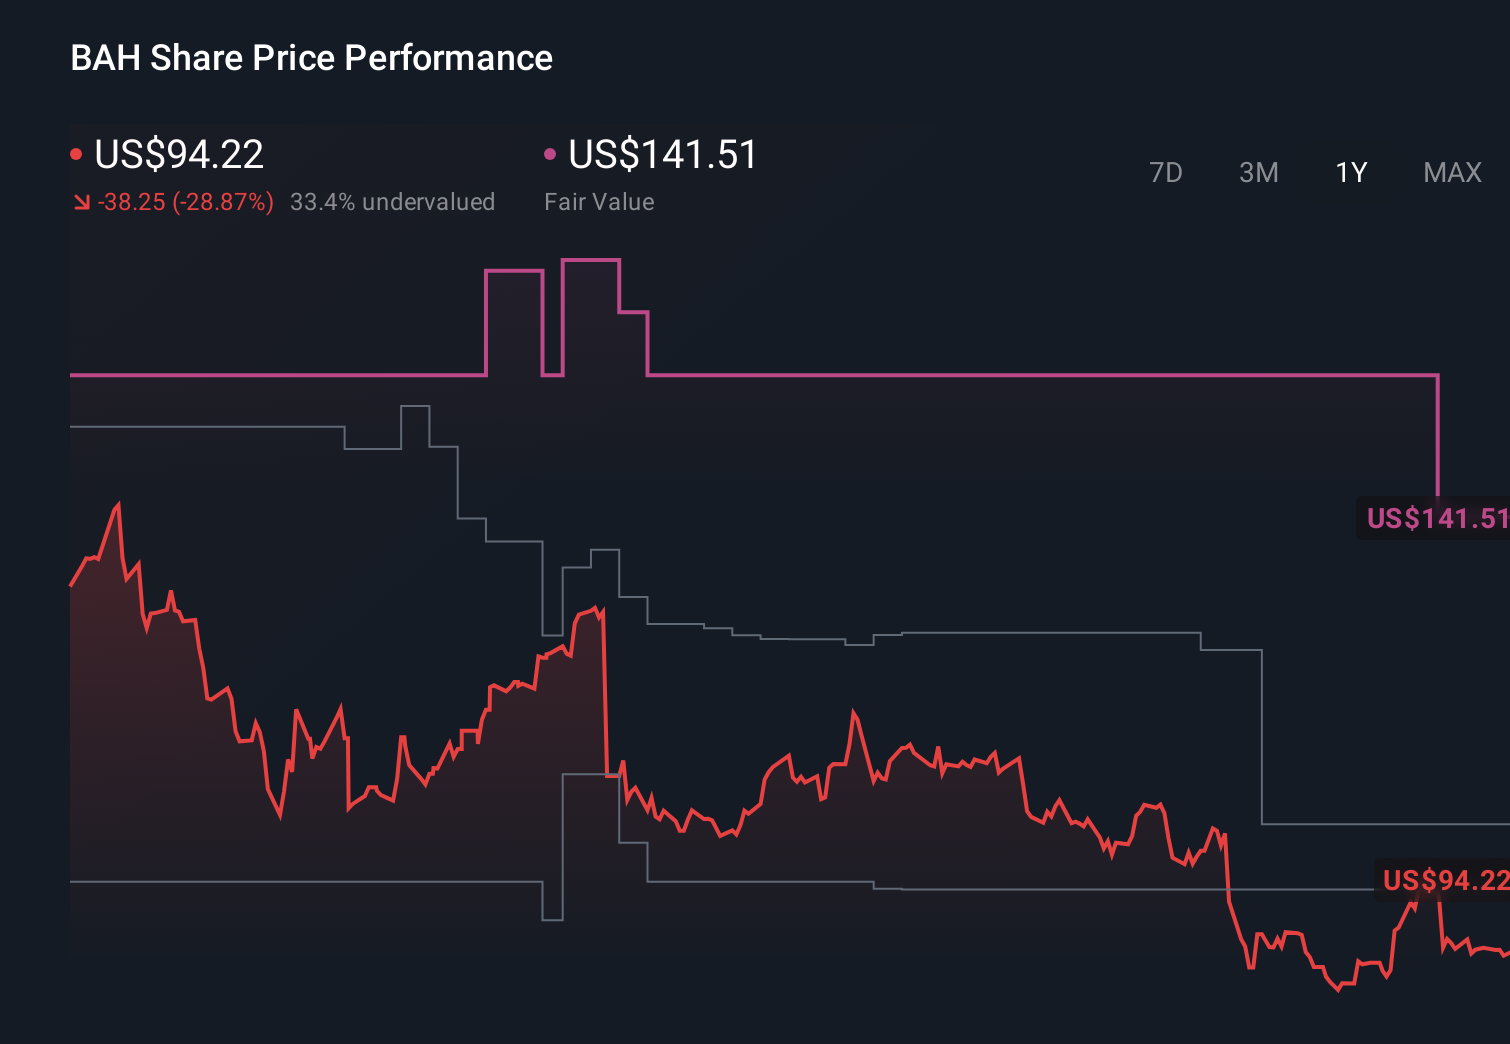
- The stock last closed at US$89.34, with returns of 4.9% over 7 days, 1.5% over 30 days, 5.2% year to date, a 29.4% decline over 1 year and a 3.1% decline over 3 years, while the 5 year return sits at 5.4%.
- Recently, investors have been paying closer attention to Booz Allen Hamilton Holding as broader coverage has highlighted the company in evergreen research feeds and valuation focused commentary. This backdrop helps frame the recent share price moves and raises the question of whether the market is pricing the business efficiently.
- On our checks, Booz Allen Hamilton Holding scores a 5 out of 6 valuation score. This suggests there is more to unpack in how different valuation methods assess the stock, and we will also finish by looking at a way to go one step further than the usual models.
Approach 1: Booz Allen Hamilton Holding Discounted Cash Flow (DCF) Analysis
A Discounted Cash Flow, or DCF, model estimates what a company might be worth by projecting its future cash flows and discounting them back to today’s value using a required return.
For Booz Allen Hamilton Holding, the latest twelve month Free Cash Flow is about $818.1 million. Analyst and model projections, using a 2 Stage Free Cash Flow to Equity approach, extend this out with estimates up to 2028 and then extrapolated figures beyond that. By 2035, the model is using projected Free Cash Flow of $1,262.6 million, with each future year discounted back to reflect time and risk.
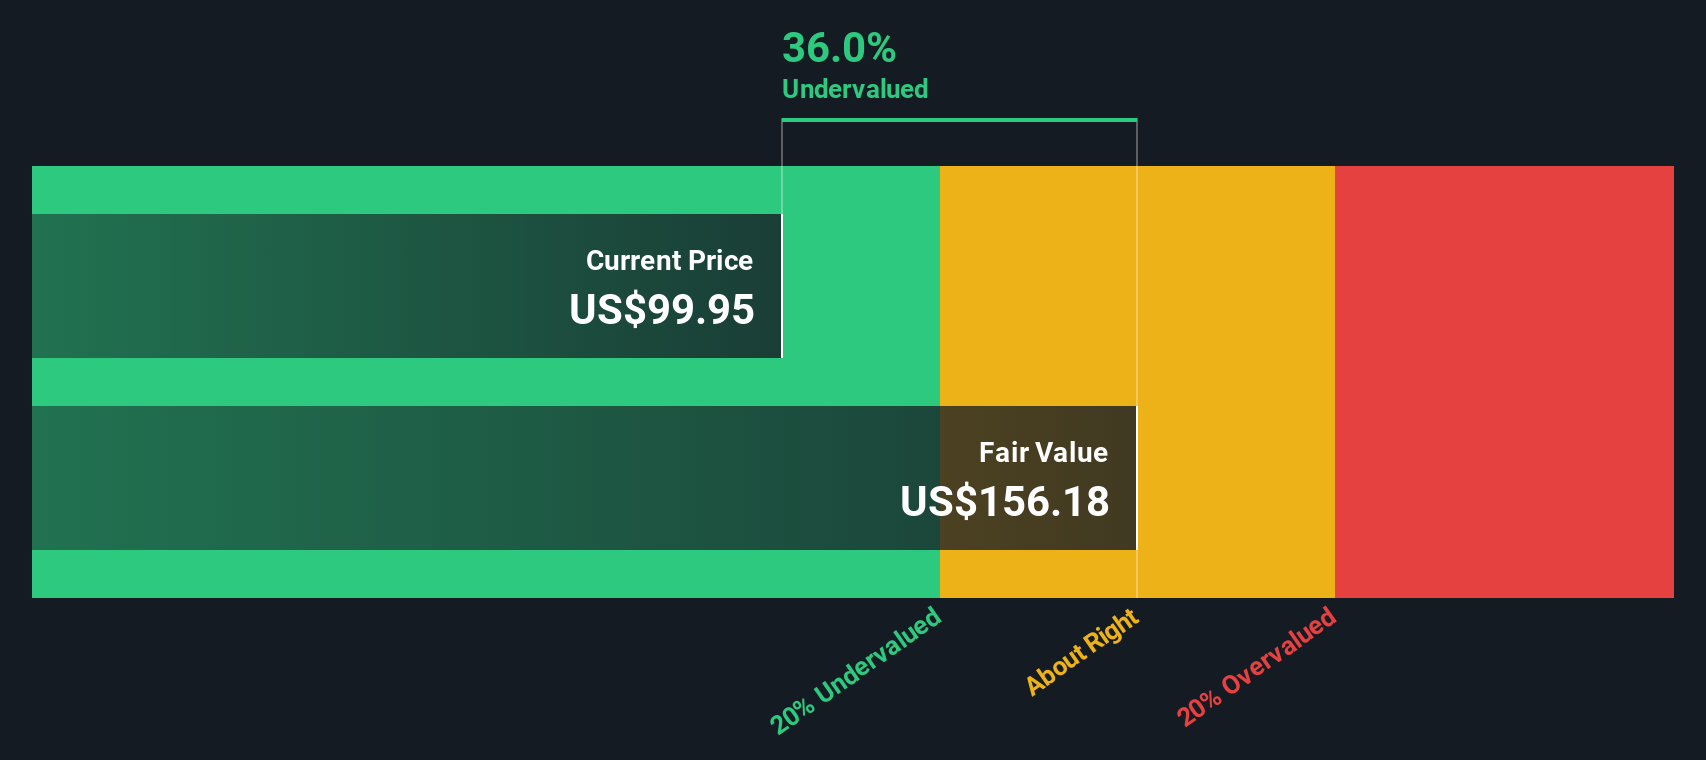
When all those discounted cash flows are summed, the DCF model produces an estimated intrinsic value of roughly $167.23 per share. Compared with the recent share price of US$89.34, this model indicates the stock trades at a 46.6% discount, meaning the market price is below the estimated cash flow based value under these assumptions.
Result: UNDERVALUED (based on this DCF model)
Our Discounted Cash Flow (DCF) analysis suggests Booz Allen Hamilton Holding is undervalued by 46.6%. Track this in your watchlist or portfolio, or discover 882 more undervalued stocks based on cash flows.
Approach 2: Booz Allen Hamilton Holding Price vs Earnings
For a profitable company, the P/E ratio is a useful way to think about value because it links what you pay for each share to the earnings that business is currently generating. A higher or lower P/E often reflects what the market expects for future growth and the level of risk investors see in those earnings.
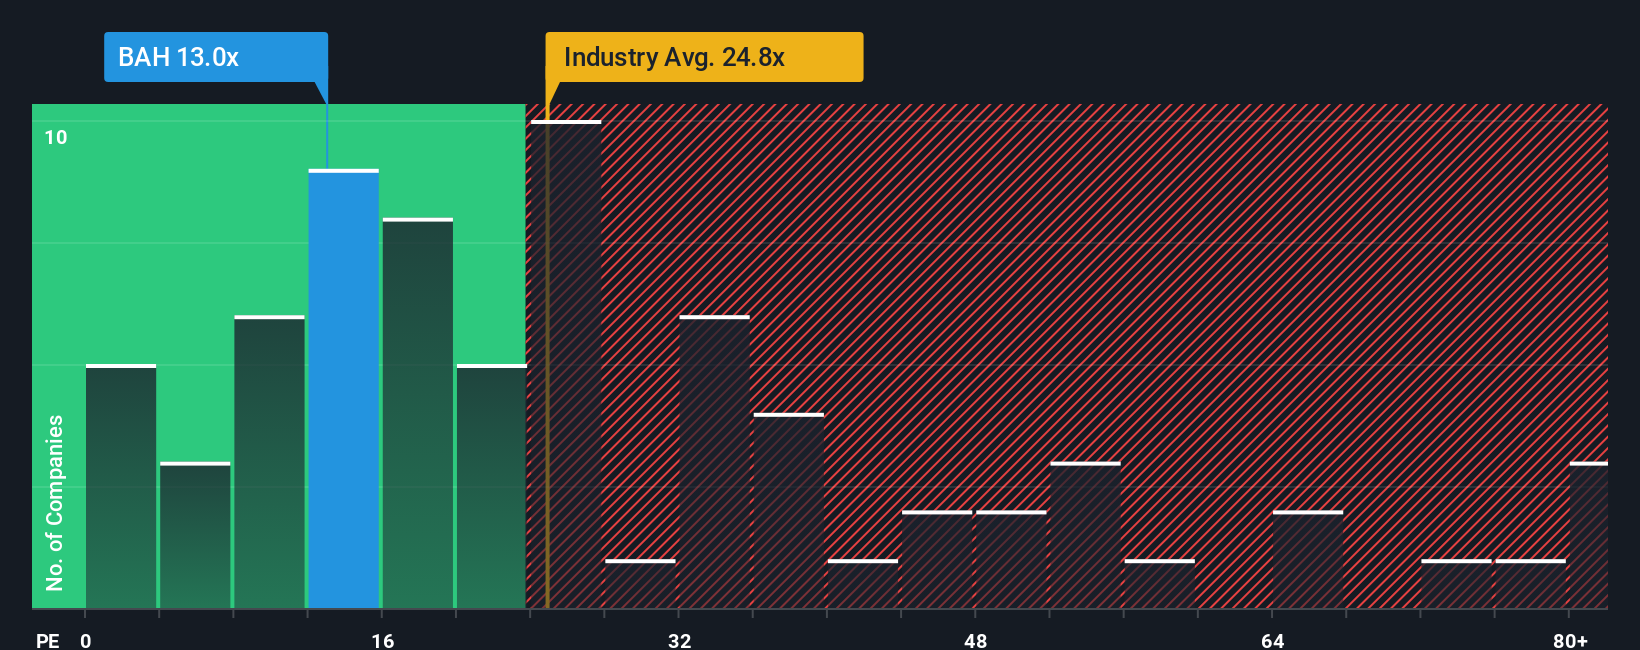
Booz Allen Hamilton Holding currently trades on a P/E of 13.20x. That sits below the Professional Services industry average P/E of 24.82x and also below the broader peer group average of 36.77x. On the surface, this suggests the market is paying less per dollar of earnings compared with many similar companies.
Simply Wall St’s Fair Ratio for Booz Allen Hamilton Holding is 19.87x. This Fair Ratio is a proprietary estimate of what a more appropriate P/E might be, after considering factors such as earnings growth, industry, profit margin, market cap and specific risks. Because it incorporates these company level attributes rather than relying only on simple peer or industry comparisons, it can provide a more tailored benchmark for valuation.
Comparing the Fair Ratio of 19.87x with the current P/E of 13.20x points to the shares trading below that Fair Ratio based reference point.
Result: UNDERVALUED
P/E ratios tell one story, but what if the real opportunity lies elsewhere? Discover 1452 companies where insiders are betting big on explosive growth.
Upgrade Your Decision Making: Choose your Booz Allen Hamilton Holding Narrative
Earlier we mentioned that there is an even better way to understand valuation. Narratives let you attach a clear story about Booz Allen Hamilton Holding to the numbers you care about by linking your view on its future revenue, earnings, margins and fair value to a forecast. You can then compare that fair value with the current price in a simple tool on Simply Wall St's Community page that updates when new news or earnings arrive. For example, one investor might build a more upbeat Narrative that aligns with a US$160 price target, while another might take a cautious view closer to US$89, and you can see which story you find more reasonable.
Do you think there's more to the story for Booz Allen Hamilton Holding? Head over to our Community to see what others are saying!
This article by Simply Wall St is general in nature. We provide commentary based on historical data and analyst forecasts only using an unbiased methodology and our articles are not intended to be financial advice. It does not constitute a recommendation to buy or sell any stock, and does not take account of your objectives, or your financial situation. We aim to bring you long-term focused analysis driven by fundamental data. Note that our analysis may not factor in the latest price-sensitive company announcements or qualitative material. Simply Wall St has no position in any stocks mentioned.
Have feedback on this article? Concerned about the content? Get in touch with us directly. Alternatively, email editorial-team@simplywallst.com