
 Nasdaq
 华尔街日报
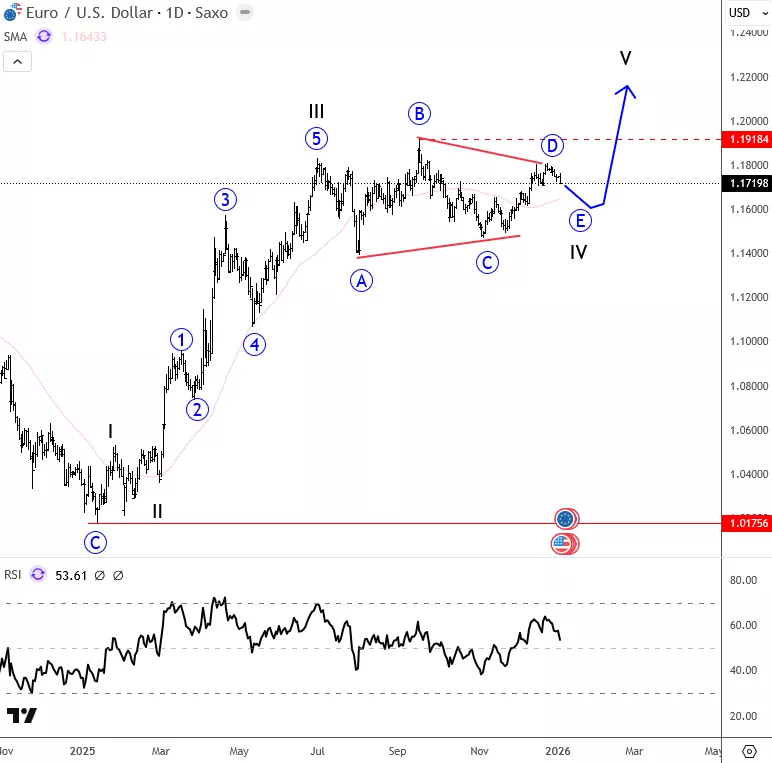
华尔街日报EURUSD Approaches Final Triangle Leg
EURUSD, as you know, has been trapped in a triangle for the last few months, and it now looks like the market could be turning lower for a final wave E within this contracting range. At the start of 2026, we could see the pair moving into some interesting support areas where this pattern may complete. The first support comes in around 1.1657, followed by a deeper support near the 1.1561 area; zones where wave E could potentially come to an end. So for now, the move lower appears to be underway, especially after the break of channel support around 1.1750 at the end of December. But after this corrective phase is done, we would expect more upside on the euro.
www.wavetraders.com
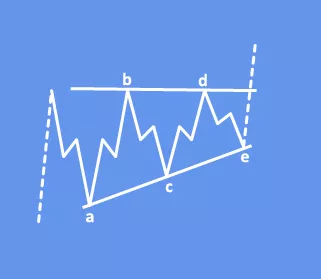
A bullish running triangle is a continuation pattern that forms when price consolidates while maintaining strong underlying demand. Unlike a regular triangle, the final corrective wave fails to reach the prior extreme, showing that buyers are stepping in early. This structure often precedes a sharp upside breakout, signaling trend strength rather than weakness.
www.wavetraders.com
Special Offer 40 % Off
-Yearly membership and also get EW Shcool videos for free.
-First-time users, can also apply for 14 day trial period, but still take advantage of 40% discount on Monthly package.
Code ew2026 for a 40% discount.
EXPLORE HERE
For a detailed view and more analysis like this, you can watch below our latest recording of a live webinar streamed on Monday December 05: