
 Nasdaq
 华尔街日报
华尔街日报Okuma (TSE:6103) Valuation Check After Recent Share Price Move
Event driven snapshot of Okuma shares
Okuma (TSE:6103) has come onto investors’ radar after a recent price move, with the shares last closing at ¥3,640. That has prompted closer attention to its fundamentals and recent return profile.
See our latest analysis for Okuma.
That latest move comes after a mixed few months for Okuma, with a 90 day share price return of 4.45% and a 1 year total shareholder return of 10.44%, while the 3 year total shareholder return of 70.30% points to momentum that has been strong over a longer horizon.
If Okuma’s recent moves have you looking across industrial names, it could be worth widening your search to find other ideas through fast growing stocks with high insider ownership.
With Okuma trading at ¥3,640, an intrinsic value estimate that points to a sizeable discount and analyst targets implying only a modest upside set up an obvious question: is there hidden value here, or is the market already pricing in future growth?
Price-to-Earnings of 20.9x: Is it justified?
On a P/E of 20.9x at a last close of ¥3,640, Okuma screens as more expensive than both its industry and peer group on earnings.
The P/E ratio compares the current share price with earnings per share. It shows how many years of earnings the market is paying for. For a machinery manufacturer like Okuma, investors often use P/E to gauge how much future earnings strength is being priced into a cyclical business.
Here, the current P/E of 20.9x sits above the estimated fair P/E of 19.3x. This suggests the market is paying a richer multiple than that fair ratio implies. Okuma is also described as expensive versus the JP Machinery industry average P/E of 12.7x and a peer average of 15.5x, a clear premium that points to higher expectations being embedded in the share price.
Explore the SWS fair ratio for Okuma
Result: Price-to-Earnings of 20.9x (OVERVALUED)
However, that premium can be vulnerable if machinery demand softens or if earnings growth slows. This could challenge the current P/E and discount story.
Find out about the key risks to this Okuma narrative.
Another view on valuation
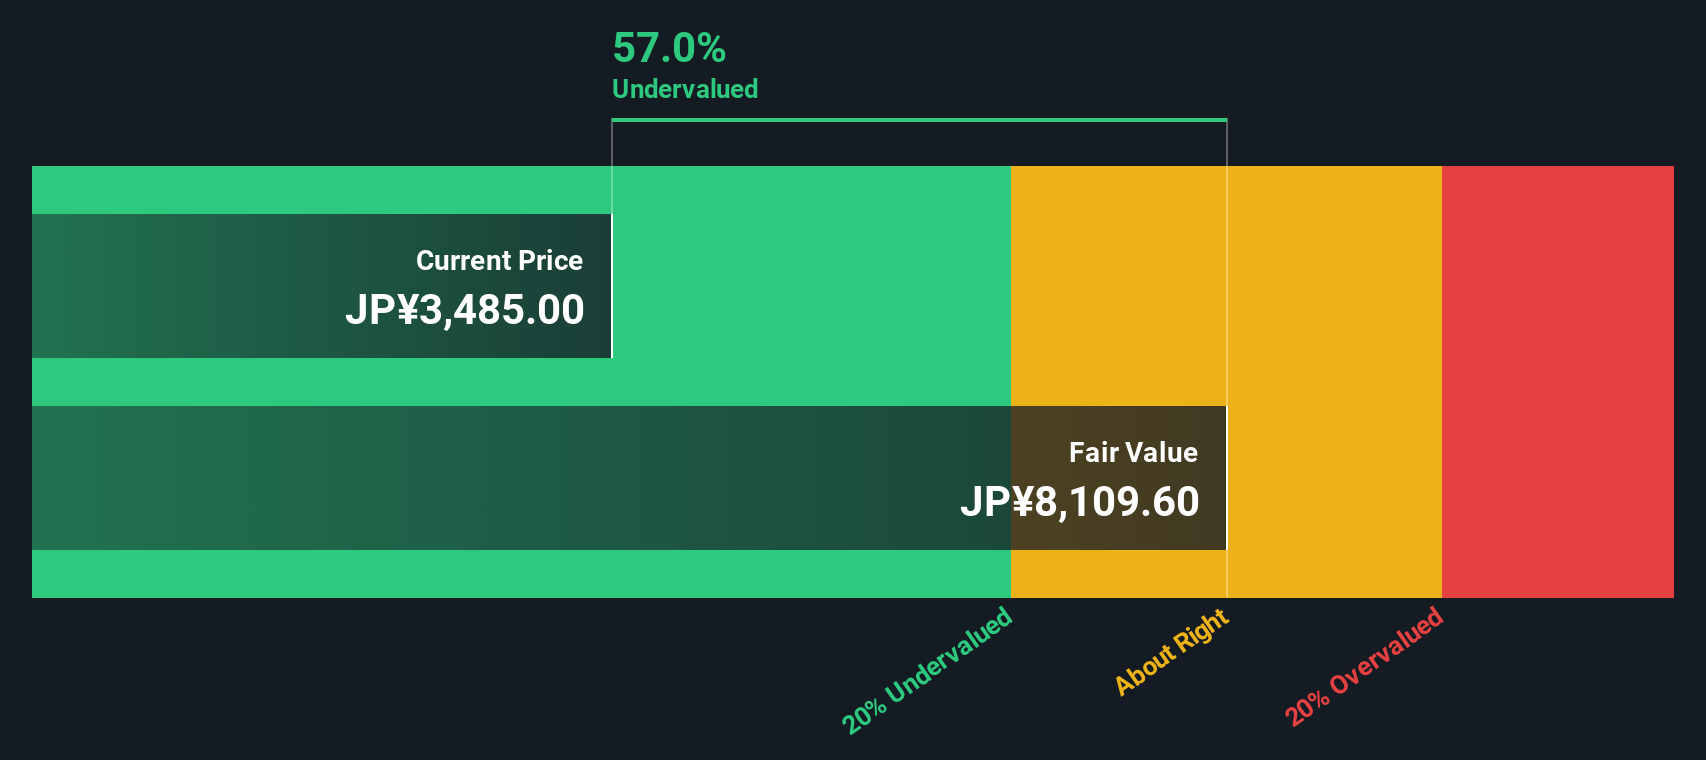
Okuma looks expensive on a 20.9x P/E, but our DCF model points in a very different direction. On that approach, the shares at ¥3,640 sit about 53.3% below an estimated fair value of ¥7,795.82. This raises a simple question for you: is the market being too cautious here?
Look into how the SWS DCF model arrives at its fair value.
Simply Wall St performs a discounted cash flow (DCF) on every stock in the world every day (check out Okuma for example). We show the entire calculation in full. You can track the result in your watchlist or portfolio and be alerted when this changes, or use our stock screener to discover 877 undervalued stocks based on their cash flows. If you save a screener we even alert you when new companies match - so you never miss a potential opportunity.
Build Your Own Okuma Narrative
If you see the numbers differently or prefer to base your view on your own work, you can build a personalised Okuma narrative in just a few minutes, Do it your way.
A great starting point for your Okuma research is our analysis highlighting 2 key rewards and 1 important warning sign that could impact your investment decision.
Ready for more investment ideas?
If Okuma has caught your attention, do not stop here. Use curated screeners to spot other opportunities that fit your style before the market moves on.
- Target potential value by reviewing companies that look underpriced on cash flows through these 877 undervalued stocks based on cash flows that may align with your return expectations.
- Tap into powerful themes in artificial intelligence by scanning these 25 AI penny stocks where businesses are building their models around data and automation.
- Strengthen your income focus by checking out these 14 dividend stocks with yields > 3% that offer yields above 3% and could complement a long term portfolio.
This article by Simply Wall St is general in nature. We provide commentary based on historical data and analyst forecasts only using an unbiased methodology and our articles are not intended to be financial advice. It does not constitute a recommendation to buy or sell any stock, and does not take account of your objectives, or your financial situation. We aim to bring you long-term focused analysis driven by fundamental data. Note that our analysis may not factor in the latest price-sensitive company announcements or qualitative material. Simply Wall St has no position in any stocks mentioned.
Have feedback on this article? Concerned about the content? Get in touch with us directly. Alternatively, email editorial-team@simplywallst.com