
 Nasdaq
 华尔街日报
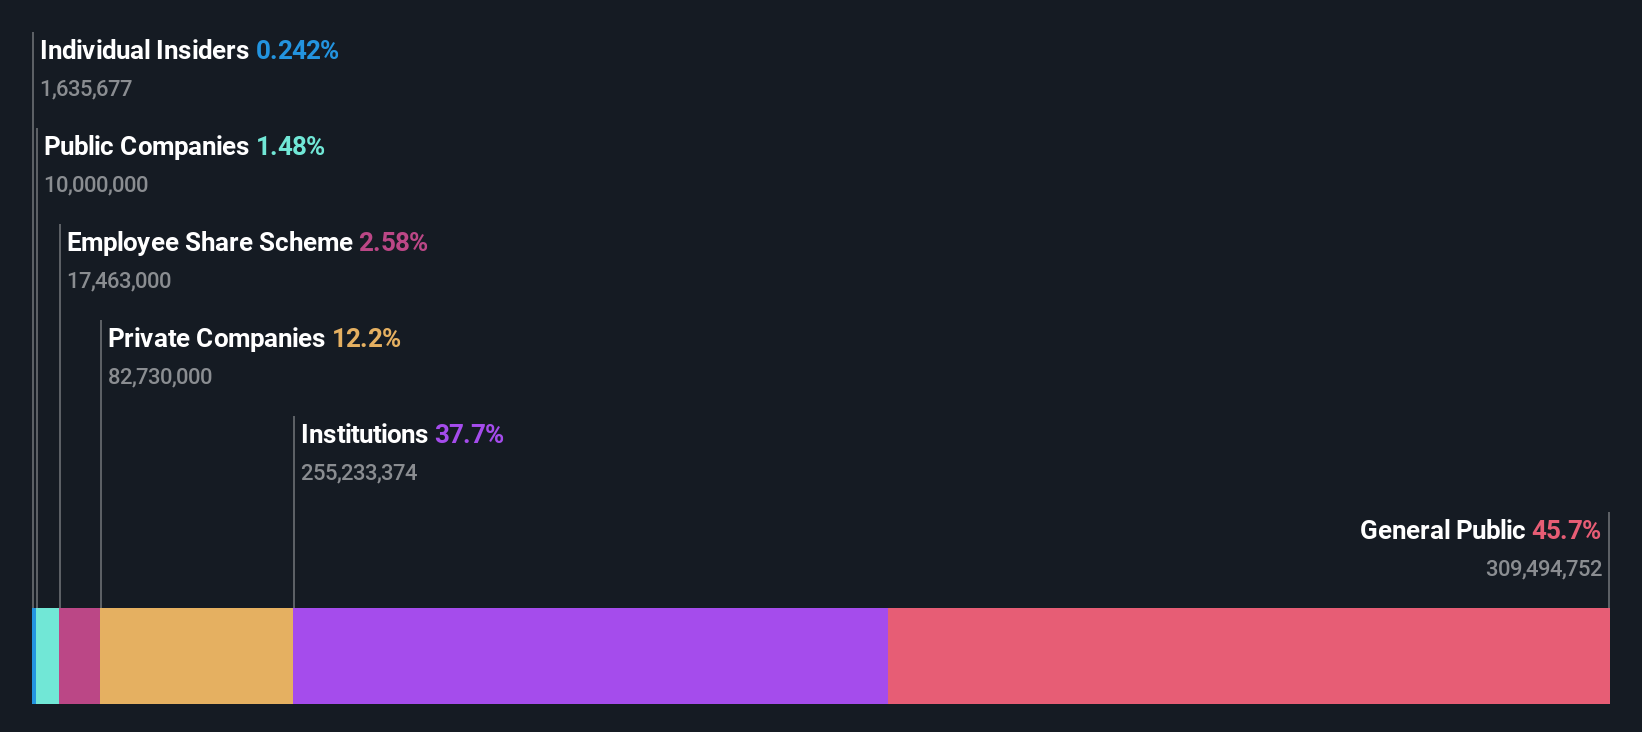
华尔街日报Institutions own 38% of Shimizu Corporation (TSE:1803) shares but individual investors control 46% of the company
Key Insights
- The considerable ownership by individual investors in Shimizu indicates that they collectively have a greater say in management and business strategy
- The top 19 shareholders own 50% of the company
- Institutional ownership in Shimizu is 38%
To get a sense of who is truly in control of Shimizu Corporation (TSE:1803), it is important to understand the ownership structure of the business. And the group that holds the biggest piece of the pie are individual investors with 46% ownership. That is, the group stands to benefit the most if the stock rises (or lose the most if there is a downturn).
And institutions on the other hand have a 38% ownership in the company. Institutions often own shares in more established companies, while it's not unusual to see insiders own a fair bit of smaller companies.
Let's take a closer look to see what the different types of shareholders can tell us about Shimizu.
Check out our latest analysis for Shimizu
What Does The Institutional Ownership Tell Us About Shimizu?
Institutional investors commonly compare their own returns to the returns of a commonly followed index. So they generally do consider buying larger companies that are included in the relevant benchmark index.
As you can see, institutional investors have a fair amount of stake in Shimizu. This implies the analysts working for those institutions have looked at the stock and they like it. But just like anyone else, they could be wrong. It is not uncommon to see a big share price drop if two large institutional investors try to sell out of a stock at the same time. So it is worth checking the past earnings trajectory of Shimizu, (below). Of course, keep in mind that there are other factors to consider, too.

We note that hedge funds don't have a meaningful investment in Shimizu. Looking at our data, we can see that the largest shareholder is Shimizu Co., Ltd. (Nagahama) with 12% of shares outstanding. With 5.7% and 5.3% of the shares outstanding respectively, The Shimizu Foundation and BlackRock, Inc. are the second and third largest shareholders.
Looking at the shareholder registry, we can see that 50% of the ownership is controlled by the top 19 shareholders, meaning that no single shareholder has a majority interest in the ownership.
While it makes sense to study institutional ownership data for a company, it also makes sense to study analyst sentiments to know which way the wind is blowing. Quite a few analysts cover the stock, so you could look into forecast growth quite easily.
Insider Ownership Of Shimizu
The definition of company insiders can be subjective and does vary between jurisdictions. Our data reflects individual insiders, capturing board members at the very least. Company management run the business, but the CEO will answer to the board, even if he or she is a member of it.
Insider ownership is positive when it signals leadership are thinking like the true owners of the company. However, high insider ownership can also give immense power to a small group within the company. This can be negative in some circumstances.
Our most recent data indicates that insiders own less than 1% of Shimizu Corporation. However, it's possible that insiders might have an indirect interest through a more complex structure. As it is a large company, we'd only expect insiders to own a small percentage of it. But it's worth noting that they own JP¥4.5b worth of shares. In this sort of situation, it can be more interesting to see if those insiders have been buying or selling.
General Public Ownership
With a 46% ownership, the general public, mostly comprising of individual investors, have some degree of sway over Shimizu. While this group can't necessarily call the shots, it can certainly have a real influence on how the company is run.
Private Company Ownership
We can see that Private Companies own 12%, of the shares on issue. Private companies may be related parties. Sometimes insiders have an interest in a public company through a holding in a private company, rather than in their own capacity as an individual. While it's hard to draw any broad stroke conclusions, it is worth noting as an area for further research.
Next Steps:
It's always worth thinking about the different groups who own shares in a company. But to understand Shimizu better, we need to consider many other factors. To that end, you should be aware of the 1 warning sign we've spotted with Shimizu .
But ultimately it is the future, not the past, that will determine how well the owners of this business will do. Therefore we think it advisable to take a look at this free report showing whether analysts are predicting a brighter future.
NB: Figures in this article are calculated using data from the last twelve months, which refer to the 12-month period ending on the last date of the month the financial statement is dated. This may not be consistent with full year annual report figures.
Have feedback on this article? Concerned about the content? Get in touch with us directly. Alternatively, email editorial-team (at) simplywallst.com.
This article by Simply Wall St is general in nature. We provide commentary based on historical data and analyst forecasts only using an unbiased methodology and our articles are not intended to be financial advice. It does not constitute a recommendation to buy or sell any stock, and does not take account of your objectives, or your financial situation. We aim to bring you long-term focused analysis driven by fundamental data. Note that our analysis may not factor in the latest price-sensitive company announcements or qualitative material. Simply Wall St has no position in any stocks mentioned.