
 Nasdaq
 华尔街日报
华尔街日报Assessing Jefferies Financial Group (JEF) Valuation After Recent Share Price Swings
Jefferies Financial Group stock snapshot
Jefferies Financial Group (JEF) shares recently closed at $63.46, and the stock has logged mixed short term performance, including a 2.4% gain over the past day and 1.2% over the past week.
See our latest analysis for Jefferies Financial Group.
The recent 7.3% 1 month share price return sits against a flat year to date move and a 19.8% decline in 1 year total shareholder return. At the same time, the 5 year total shareholder return of 187.97% points to stronger longer term momentum that has cooled lately as the market reassesses Jefferies Financial Group’s risk and growth profile.
If Jefferies’ recent swings have you thinking about where else capital might work hard, this could be a good moment to check out fast growing stocks with high insider ownership.
With Jefferies trading at $63.46 against an analyst consensus of $70.67 and a 1 year total return decline of 19.8%, investors may ask whether this represents a reset that creates a potential buying opportunity or whether the market is already pricing in future growth.
Price-to-Earnings of 20.4x: Is it justified?
On a P/E of 20.4x against a last close of $63.46, Jefferies Financial Group screens slightly cheaper than peers, which suggests the market is not assigning a premium for its earnings.
The P/E ratio compares the share price to earnings per share, so it tells you how many dollars investors are paying for each dollar of current earnings. For an investment banking and capital markets firm like Jefferies, this is a common yardstick because earnings are a central focus for assessing the core franchise.
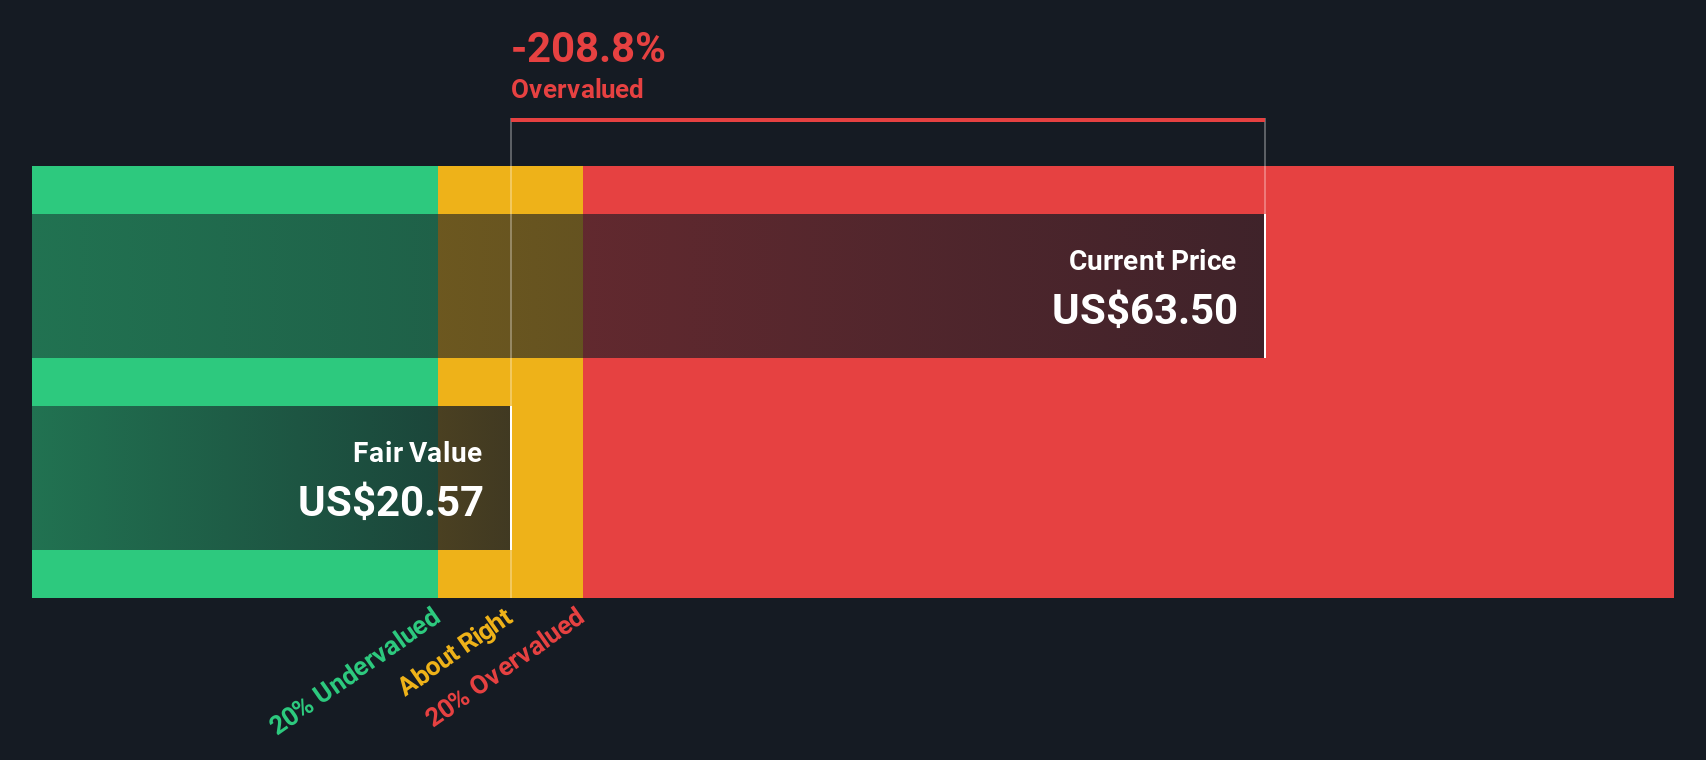
Here, Jefferies is described as good value on P/E when set against both its peer group average of 21.1x and the wider US Capital Markets industry average of 25.6x. At the same time, the SWS DCF model flags that the current price of $63.46 sits above an estimated fair value of $50.70 and suggests a fair P/E closer to 18.4x, a level the market could also move toward if sentiment or expectations change.
Compared with the broader industry, Jefferies’ 20.4x P/E looks meaningfully lower than the 25.6x industry average, which implies investors are paying less for each dollar of earnings than they are for many other capital markets names. Yet when you line that up against the estimated fair P/E of 18.4x, the current market valuation also looks richer than what the regression based fair ratio implies.
Explore the SWS fair ratio for Jefferies Financial Group
Result: Price-to-Earnings of 20.4x (ABOUT RIGHT)
However, you still need to weigh risks such as a 19.8% 1 year total return decline, as well as the possibility that recent 4.4% revenue growth proves hard to sustain.
Find out about the key risks to this Jefferies Financial Group narrative.
Another view: DCF points to a different price
While the P/E ratio of 20.4x suggests Jefferies Financial Group is slightly cheaper than peers, our DCF model points the other way. With an estimated fair value of $50.70 versus the current $63.46, the stock screens as expensive on this measure.
That gap raises a simple question for you: are earnings multiples giving a clearer picture right now, or is the cash flow view hinting at valuation risk that is easy to brush aside?
Look into how the SWS DCF model arrives at its fair value.
Simply Wall St performs a discounted cash flow (DCF) on every stock in the world every day (check out Jefferies Financial Group for example). We show the entire calculation in full. You can track the result in your watchlist or portfolio and be alerted when this changes, or use our stock screener to discover 878 undervalued stocks based on their cash flows. If you save a screener we even alert you when new companies match - so you never miss a potential opportunity.
Build Your Own Jefferies Financial Group Narrative
If this perspective does not fully align with your own and you prefer to analyze the numbers directly, you can build a custom thesis in minutes with Do it your way.
A great starting point for your Jefferies Financial Group research is our analysis highlighting 3 key rewards and 1 important warning sign that could impact your investment decision.
Ready to hunt for your next idea?
If Jefferies has sparked your interest, do not stop here. Give yourself more options by lining up a few fresh ideas before your next move.
- Target potential mispricings by scanning these 878 undervalued stocks based on cash flows where current prices sit below what cash flows suggest.
- Consider major tech shifts by filtering for these 25 AI penny stocks that tie current earnings to artificial intelligence themes.
- Strengthen your income focus by screening these 14 dividend stocks with yields > 3% to spot companies sharing a higher portion of their profits with shareholders.
This article by Simply Wall St is general in nature. We provide commentary based on historical data and analyst forecasts only using an unbiased methodology and our articles are not intended to be financial advice. It does not constitute a recommendation to buy or sell any stock, and does not take account of your objectives, or your financial situation. We aim to bring you long-term focused analysis driven by fundamental data. Note that our analysis may not factor in the latest price-sensitive company announcements or qualitative material. Simply Wall St has no position in any stocks mentioned.
Have feedback on this article? Concerned about the content? Get in touch with us directly. Alternatively, email editorial-team@simplywallst.com