
 Nasdaq
 华尔街日报
华尔街日报TSX Value Picks Including Exchange Income That May Be Priced Below Intrinsic Estimates
As we enter 2026, investors are encouraged to reassess their portfolios in light of recent economic developments, particularly as Canadian employment trends have shown unexpected strength and interest rates remain low. In this context, identifying undervalued stocks on the TSX can be a prudent strategy for those looking to capitalize on potential market inefficiencies and enhance portfolio value.
Top 10 Undervalued Stocks Based On Cash Flows In Canada
| Name | Current Price | Fair Value (Est) | Discount (Est) |
| Topicus.com (TSXV:TOI) | CA$125.05 | CA$224.95 | 44.4% |
| Neo Performance Materials (TSX:NEO) | CA$16.89 | CA$31.18 | 45.8% |
| Major Drilling Group International (TSX:MDI) | CA$13.37 | CA$21.99 | 39.2% |
| kneat.com (TSX:KSI) | CA$4.98 | CA$9.38 | 46.9% |
| Kinaxis (TSX:KXS) | CA$171.94 | CA$326.69 | 47.4% |
| EQB (TSX:EQB) | CA$104.36 | CA$184.71 | 43.5% |
| Endeavour Mining (TSX:EDV) | CA$68.03 | CA$123.01 | 44.7% |
| Dexterra Group (TSX:DXT) | CA$11.69 | CA$22.91 | 49% |
| Black Diamond Group (TSX:BDI) | CA$14.82 | CA$28.57 | 48.1% |
| Almonty Industries (TSX:AII) | CA$12.03 | CA$23.37 | 48.5% |
We'll examine a selection from our screener results.
Exchange Income (TSX:EIF)
Overview: Exchange Income Corporation operates in aerospace, aviation services and equipment, and manufacturing sectors globally, with a market cap of CA$4.45 billion.
Operations: The company generates revenue from two main segments: Aerospace & Aviation, which contributes CA$1.93 billion, and Manufacturing, which accounts for CA$1.10 billion.
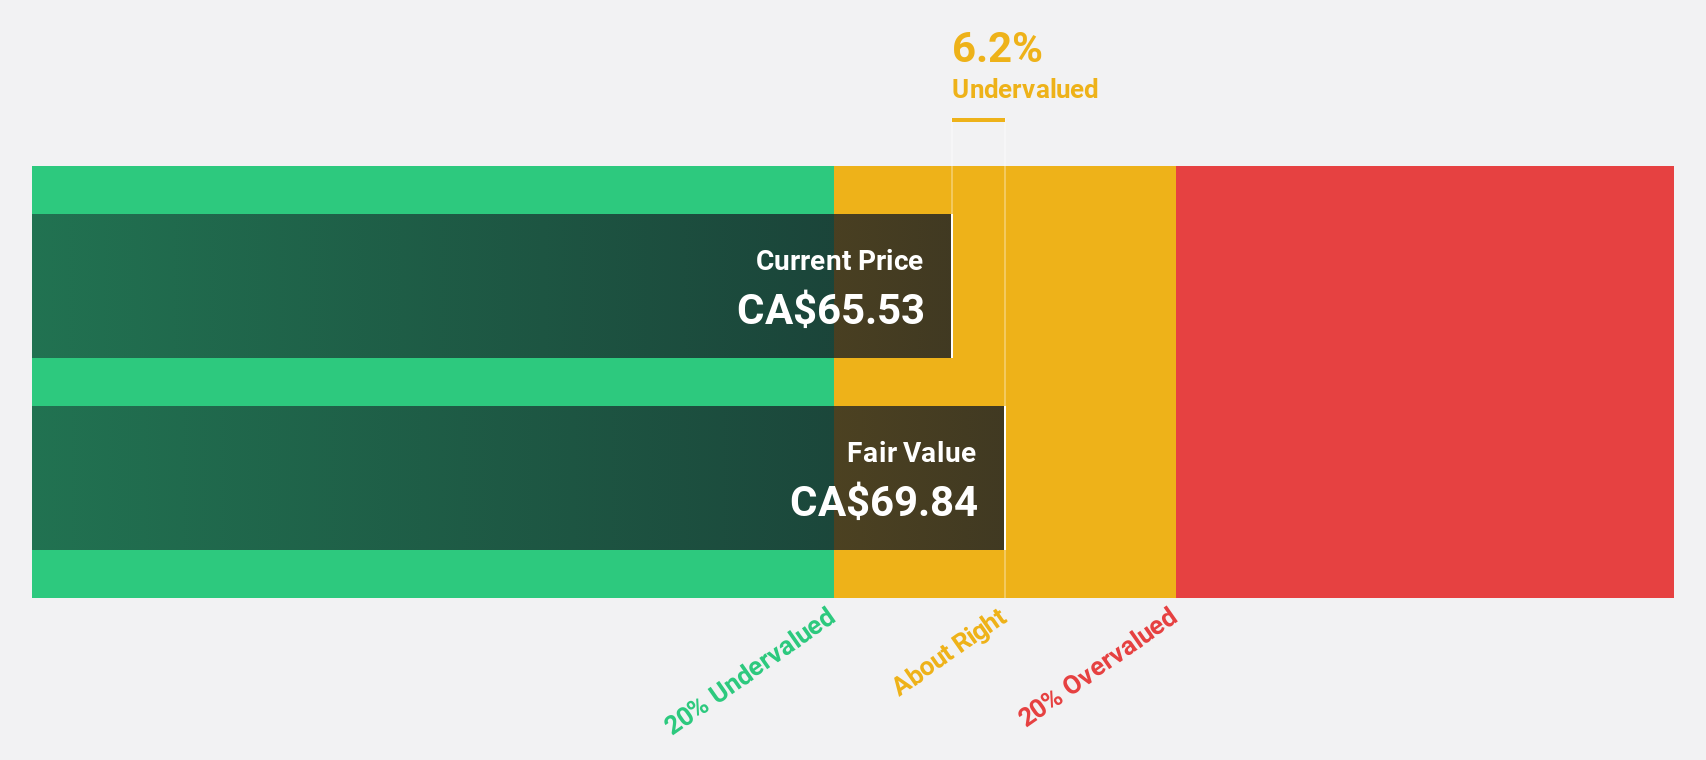
Estimated Discount To Fair Value: 37%
Exchange Income Corporation is trading at CA$81.84, significantly below its estimated fair value of CA$129.81, suggesting it may be undervalued based on cash flows. Despite a recent dividend increase to $2.76 per share annually, dividends are not well covered by earnings or free cash flows, raising sustainability concerns. Earnings grew 18.1% last year and are forecast to grow 24.24% annually over the next three years, outpacing Canadian market growth expectations of 11.5%.
- Upon reviewing our latest growth report, Exchange Income's projected financial performance appears quite optimistic.
- Click here to discover the nuances of Exchange Income with our detailed financial health report.
kneat.com (TSX:KSI)
Overview: kneat.com, inc. designs, develops, and supplies software for data and document management in regulated environments across North America, Europe, and the Asia Pacific with a market cap of CA$475.70 million.
Operations: The company generates revenue of CA$60.00 million from its software and programming segment, focusing on data and document management solutions in regulated environments across various regions.
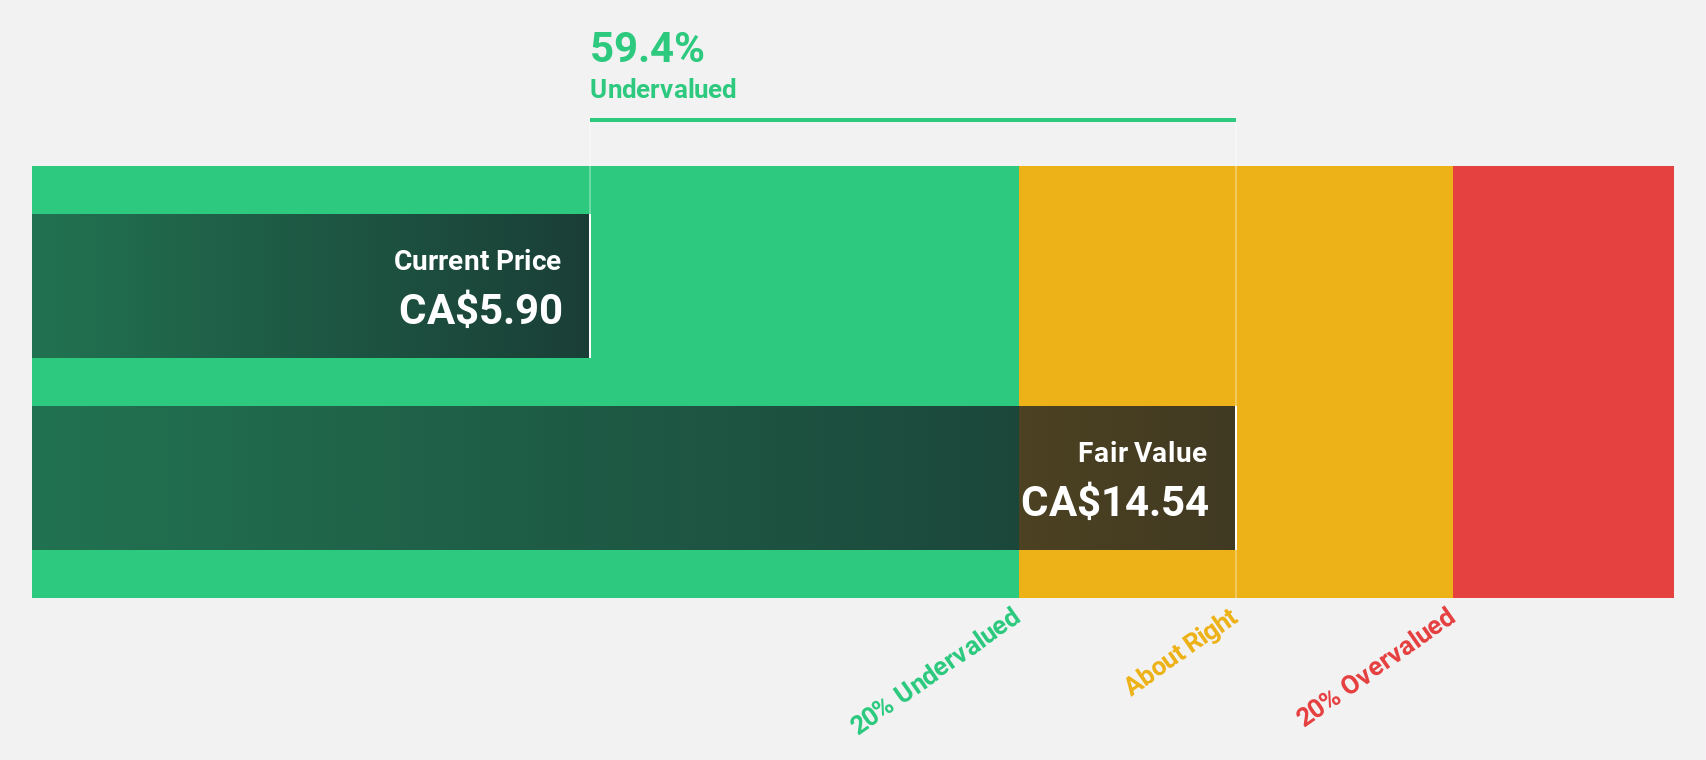
Estimated Discount To Fair Value: 46.9%
Kneat.com, trading at CA$4.98, is priced significantly below its estimated fair value of CA$9.38, reflecting potential undervaluation based on cash flows. The company anticipates becoming profitable within three years and has secured a major contract with a global specialty chemicals firm, enhancing its growth prospects. Revenue is projected to grow 21.2% annually, surpassing the Canadian market average of 5.2%. Recent earnings show improved sales but highlight ongoing profitability challenges.
- According our earnings growth report, there's an indication that kneat.com might be ready to expand.
- Unlock comprehensive insights into our analysis of kneat.com stock in this financial health report.
Savaria (TSX:SIS)
Overview: Savaria Corporation offers accessibility solutions for the elderly and physically challenged across Canada, the United States, Europe, and internationally, with a market cap of CA$1.65 billion.
Operations: The company's revenue is primarily derived from its Accessibility segment, including Adapted Vehicles, which generated CA$697.19 million, and its Patient Care segment, which contributed CA$197.90 million.
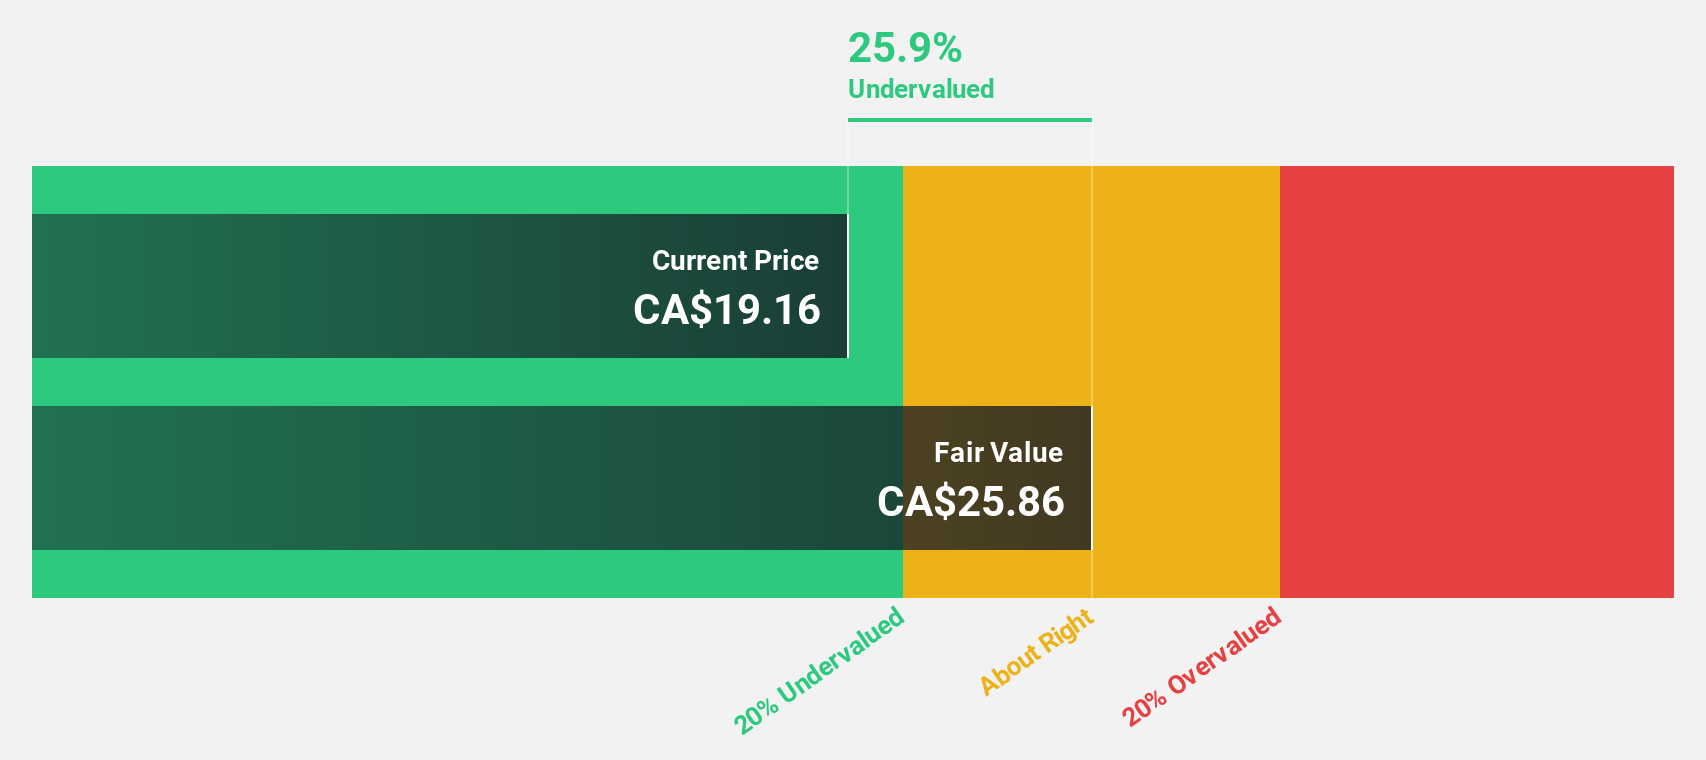
Estimated Discount To Fair Value: 36.9%
Savaria Corporation, trading at CA$23.06, is significantly undervalued with a fair value estimate of CA$36.53 based on discounted cash flows. Despite insider selling, the company boasts strong financial health and a low net debt-to-EBITDA ratio of 1.19, with CA$290 million available for strategic acquisitions. Earnings grew by 38.7% over the past year and are projected to grow annually by 29.5%, outpacing the Canadian market's growth rate of 11.5%.
- Our earnings growth report unveils the potential for significant increases in Savaria's future results.
- Delve into the full analysis health report here for a deeper understanding of Savaria.
Summing It All Up
- Dive into all 27 of the Undervalued TSX Stocks Based On Cash Flows we have identified here.
- Are these companies part of your investment strategy? Use Simply Wall St to consolidate your holdings into a portfolio and gain insights with our comprehensive analysis tools.
- Simply Wall St is a revolutionary app designed for long-term stock investors, it's free and covers every market in the world.
Contemplating Other Strategies?
- Explore high-performing small cap companies that haven't yet garnered significant analyst attention.
- Diversify your portfolio with solid dividend payers offering reliable income streams to weather potential market turbulence.
- Fuel your portfolio with companies showing strong growth potential, backed by optimistic outlooks both from analysts and management.
This article by Simply Wall St is general in nature. We provide commentary based on historical data and analyst forecasts only using an unbiased methodology and our articles are not intended to be financial advice. It does not constitute a recommendation to buy or sell any stock, and does not take account of your objectives, or your financial situation. We aim to bring you long-term focused analysis driven by fundamental data. Note that our analysis may not factor in the latest price-sensitive company announcements or qualitative material. Simply Wall St has no position in any stocks mentioned.
Have feedback on this article? Concerned about the content? Get in touch with us directly. Alternatively, email editorial-team@simplywallst.com