
 Nasdaq
 华尔街日报
华尔街日报A Look At Two Harbors Investment (TWO) Valuation After Recent Share Price Strength
Two Harbors Investment (TWO) has been drawing attention after recent share moves, with the stock last closing at $10.58. You might be asking how its income profile and value score of 4 fit together.
See our latest analysis for Two Harbors Investment.
The recent 1 day share price return of 0.76% and 30 day share price return of 3.52% sit alongside a 90 day share price return of 9.64%. Meanwhile, the 1 year total shareholder return of 1.75% contrasts with a 5 year total shareholder return decline of 20.70%, indicating that momentum has been stronger in the short term than over the longer term.
If Two Harbors Investment has you reassessing income ideas, it could be a good moment to widen your search with fast growing stocks with high insider ownership.
With shares at $10.58, a value score of 4, a sizeable intrinsic discount and a small gap to a $10.90 price target, you have to ask: is this an income REIT on sale, or is the market already assuming future gains?
Price-to-Sales of 2.1x, Is it justified?
On a P/S of 2.1x at a last close of $10.58, Two Harbors Investment screens cheap against peers, yet screens expensive versus its own fair ratio.
The P/S multiple compares the company’s market value to its revenue, which is a common way to judge capital intensive or loss making businesses that do not have stable earnings. For a mortgage REIT that is currently unprofitable, P/S can give you a quick sense of how much investors are paying for each dollar of reported revenue.
Here, TWO is described as good value against both peer and industry averages, with its 2.1x P/S below the US Mortgage REITs benchmark of 4.7x. At the same time, the estimated fair P/S ratio is 0.3x, which is far lower than where the shares trade, so the current market pricing sits well above the level that regression based fair ratio work points to.
Explore the SWS fair ratio for Two Harbors Investment
Result: Price-to-Sales of 2.1x (ABOUT RIGHT)
However, you still have to weigh risks such as an annual revenue contraction of 145.14% and a net loss of $242.616 million, which could pressure future distributions.
Find out about the key risks to this Two Harbors Investment narrative.
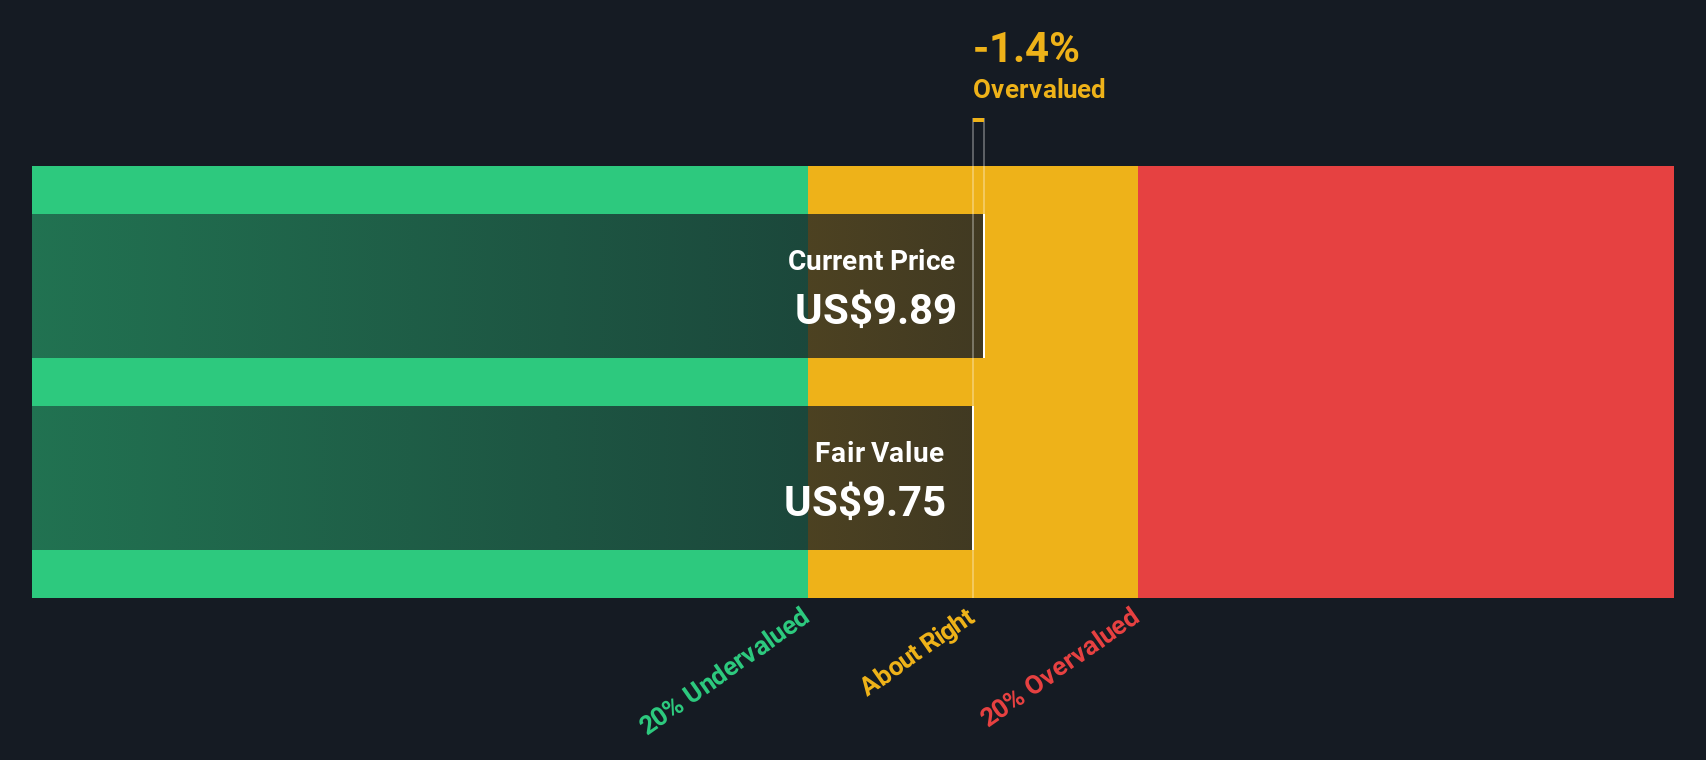
Another view: DCF sees more upside
While the 2.1x P/S ratio makes Two Harbors Investment look more expensive than its 0.3x fair ratio, our DCF model points in the opposite direction. On that view, the shares at $10.58 sit about 37.4% below an estimated fair value of $16.89, suggesting the market is pricing in a lot of caution. Which signal you trust more comes down to how comfortable you are with the assumptions behind each approach.
Look into how the SWS DCF model arrives at its fair value.
Simply Wall St performs a discounted cash flow (DCF) on every stock in the world every day (check out Two Harbors Investment for example). We show the entire calculation in full. You can track the result in your watchlist or portfolio and be alerted when this changes, or use our stock screener to discover 868 undervalued stocks based on their cash flows. If you save a screener we even alert you when new companies match - so you never miss a potential opportunity.
Build Your Own Two Harbors Investment Narrative
If you see the numbers differently, or prefer to test your own assumptions, you can build a custom view in just a few minutes, starting with Do it your way.
A great starting point for your Two Harbors Investment research is our analysis highlighting 3 key rewards and 1 important warning sign that could impact your investment decision.
Looking for more investment ideas?
If you stop with just one stock, you risk missing other opportunities that could fit your goals even better, so keep stretching your opportunity set.
- Target potential deep value by checking out these 868 undervalued stocks based on cash flows, built around companies where cash flow expectations and prices look out of sync.
- Spot emerging themes in digital assets with these 79 cryptocurrency and blockchain stocks, helping you focus on listed businesses tied to cryptocurrency and blockchain trends.
- Strengthen your income watchlist by scanning these 14 dividend stocks with yields > 3%, highlighting companies offering dividend yields above 3%.
This article by Simply Wall St is general in nature. We provide commentary based on historical data and analyst forecasts only using an unbiased methodology and our articles are not intended to be financial advice. It does not constitute a recommendation to buy or sell any stock, and does not take account of your objectives, or your financial situation. We aim to bring you long-term focused analysis driven by fundamental data. Note that our analysis may not factor in the latest price-sensitive company announcements or qualitative material. Simply Wall St has no position in any stocks mentioned.
Have feedback on this article? Concerned about the content? Get in touch with us directly. Alternatively, email editorial-team@simplywallst.com