
 Nasdaq
 华尔街日报
华尔街日报Is AbbVie (ABBV) Still Attractively Priced After A 31.8% One Year Gain?
- If you are wondering whether AbbVie stock still offers value at its current level, this article will walk through how the numbers stack up and what that could mean for your expectations.
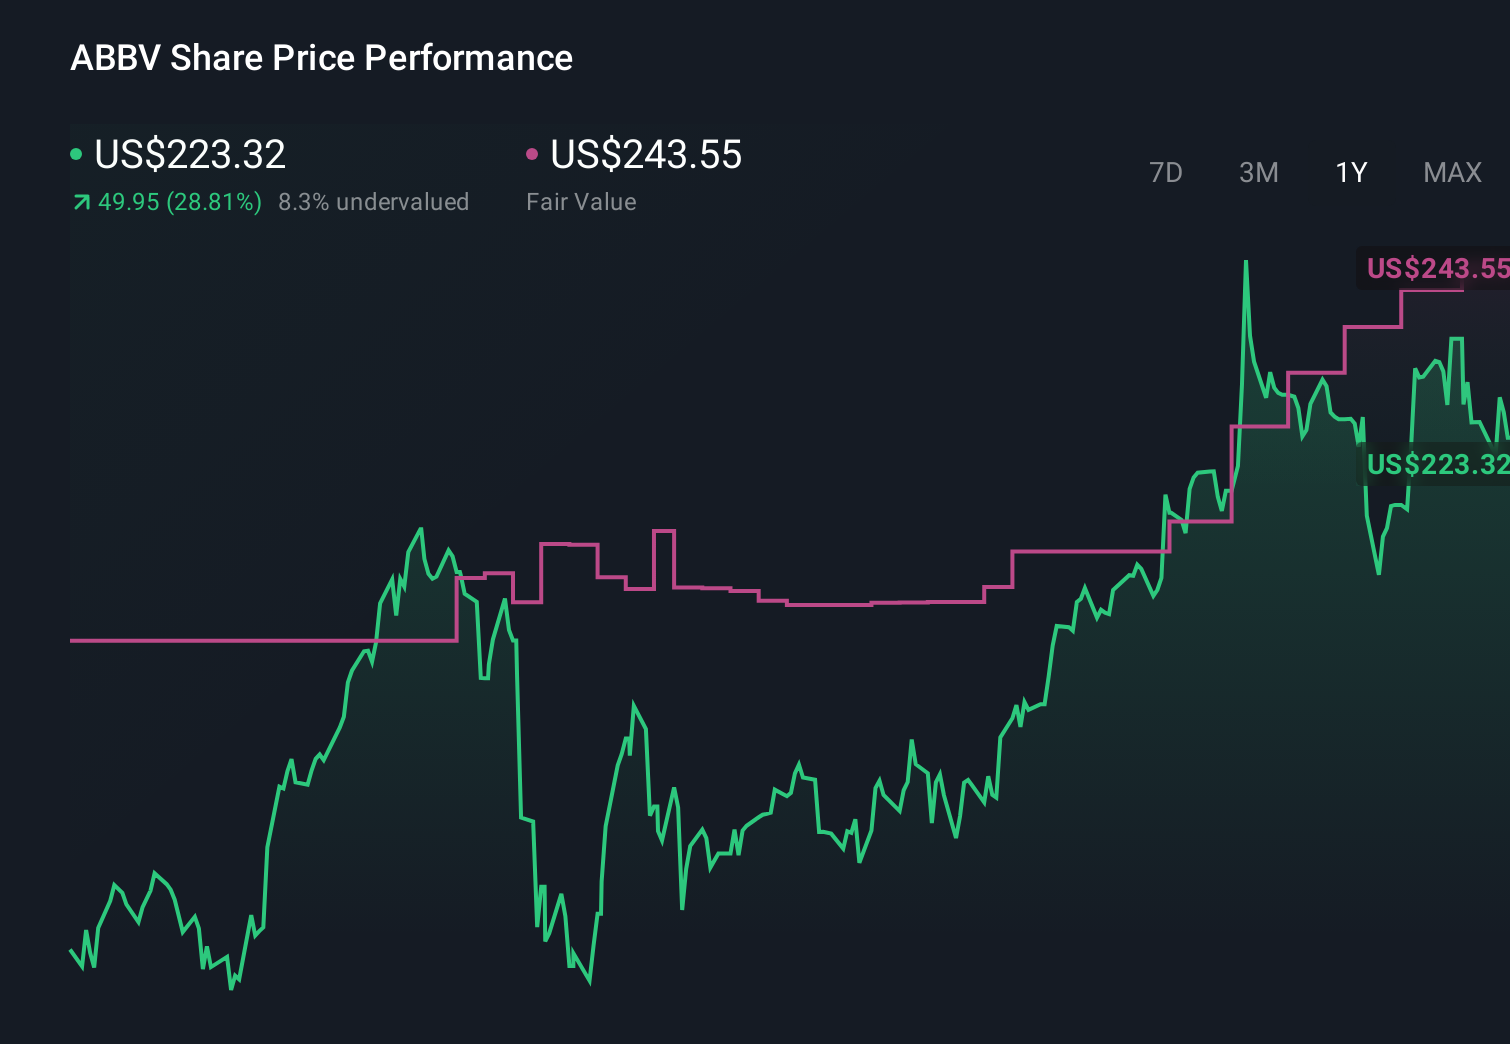
- AbbVie recently closed at US$229.31, with a 7 day return of a 0.7% decline, a 30 day return of 1.4%, and a 1 year return of 31.8%, which may catch the eye of investors thinking about both growth potential and changing risk perceptions.
- Recent coverage around AbbVie has focused on its role as a large US pharmaceutical and biotech company and the way investors weigh its pipeline and established treatments when assessing the stock. This context helps frame why the share price and sentiment may have shifted over different time frames.
- On our valuation checks, AbbVie scores 4 out of 6, as shown by its valuation score. Next, we will look at the usual methods such as DCF and multiples, before finishing with a way to think about value that can tie all of these tools together.
Approach 1: AbbVie Discounted Cash Flow (DCF) Analysis
A Discounted Cash Flow model takes estimates of a company’s future cash flows and discounts them back to today using a required return. The goal is to translate those future dollars into a present value per share.
For AbbVie, the model used is a 2 Stage Free Cash Flow to Equity approach, based on cash flow projections. The latest twelve month Free Cash Flow is about $19.9b. Analyst and extrapolated estimates suggest Free Cash Flow in 2030 of around $32.3b, with interim projections between 2026 and 2035 ranging from roughly $25.9b to $36.9b before discounting.
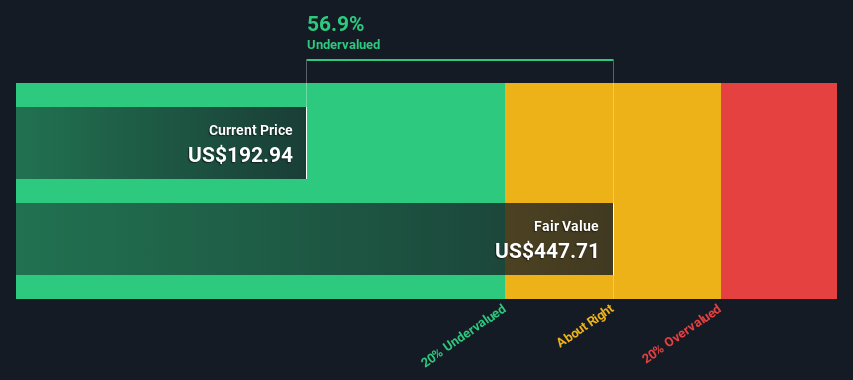
After discounting those projected cash flows back to today, the model arrives at an estimated intrinsic value of about $387.10 per share. Compared with the recent share price of $229.31, this output implies the shares are about 40.8% below that modelled value. Within this DCF framework, AbbVie appears to be trading at a meaningful discount.
Result: UNDERVALUED
Our Discounted Cash Flow (DCF) analysis suggests AbbVie is undervalued by 40.8%. Track this in your watchlist or portfolio, or discover 875 more undervalued stocks based on cash flows.
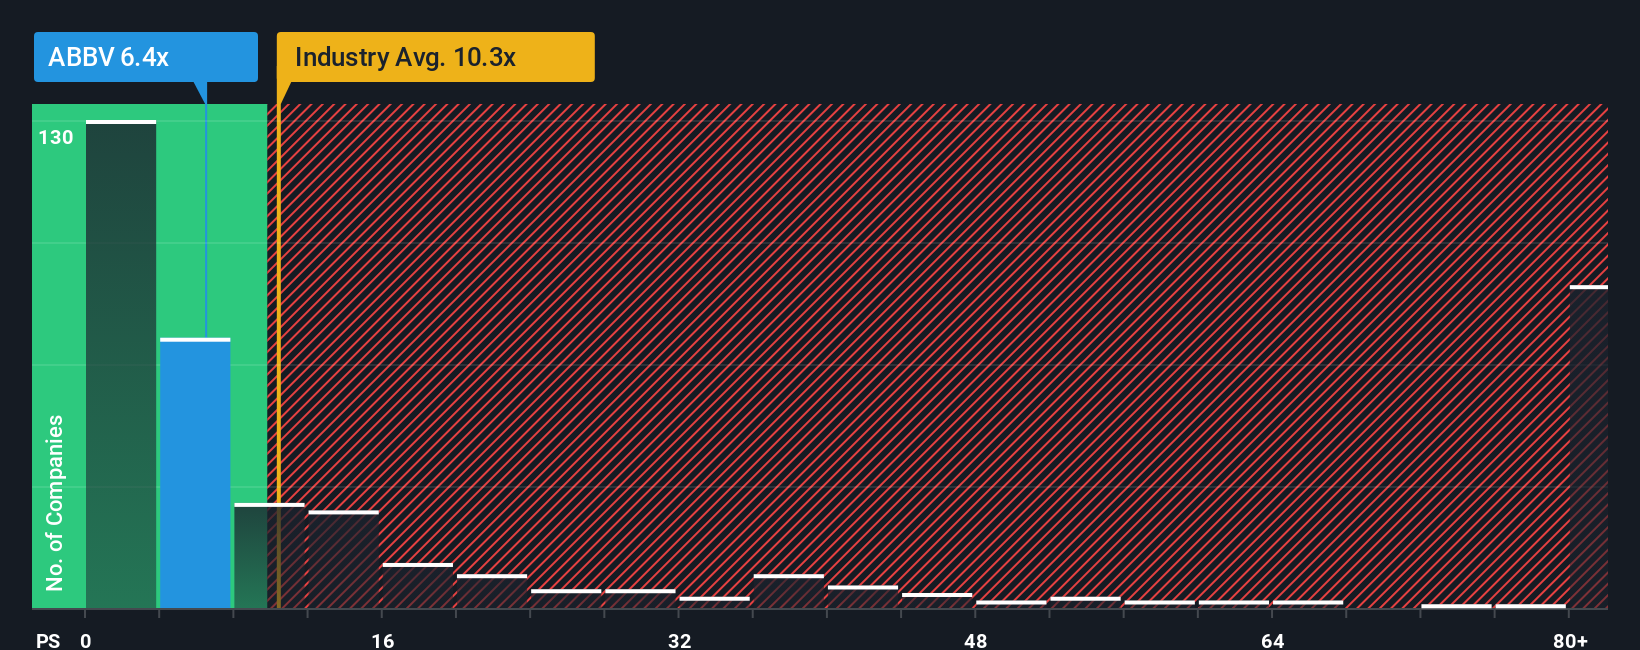
Approach 2: AbbVie Price vs Sales (P/S)
For a large, profitable pharma business like AbbVie, the Price to Sales ratio is a useful cross check because it relates the share price to the revenue investors are paying for, which can be easier to compare across companies with different accounting treatments.
What counts as a reasonable P/S often reflects how the market views a company’s growth outlook and risk. Higher expected growth and lower perceived risk can support a higher multiple, while lower growth expectations or higher uncertainty usually line up with a lower figure.
AbbVie currently trades on a P/S of 6.79x. That sits close to the Biotechs industry average of 11.73x and the peer group average of 6.37x. Simply Wall St’s Fair Ratio for AbbVie is 11.88x, which is its proprietary view of what AbbVie’s P/S might be given factors such as earnings growth, profit margins, industry, market cap and risk profile.
Because the Fair Ratio is tailored to AbbVie’s specific characteristics, it can offer a more company focused reference point than a simple comparison with peers or the broader industry. With AbbVie’s current 6.79x P/S sitting below the 11.88x Fair Ratio, this framework points to the shares trading at a discount on a sales basis.
Result: UNDERVALUED
P/S ratios tell one story, but what if the real opportunity lies elsewhere? Discover 1466 companies where insiders are betting big on explosive growth.
Upgrade Your Decision Making: Choose your AbbVie Narrative
Earlier we mentioned that there is an even better way to understand valuation. Let us introduce you to Narratives, which simply means writing your own story for AbbVie by linking what you think about its immunology strength, neuroscience opportunity, pipeline risks and earnings potential to a set of revenue, margin and P/E assumptions that roll into a Fair Value. You can then compare that Fair Value with today’s price to decide whether AbbVie looks attractive or stretched. This is all done within an easy tool on Simply Wall St’s Community page that updates automatically when new earnings, news or analyst targets come in. One investor might build an optimistic AbbVie Narrative that aligns with the higher analyst price target of US$255.00, while another might prefer a more cautious story closer to the lower US$170.00 target, with both perspectives clearly tied to numbers rather than gut feel.
Do you think there's more to the story for AbbVie? Head over to our Community to see what others are saying!
This article by Simply Wall St is general in nature. We provide commentary based on historical data and analyst forecasts only using an unbiased methodology and our articles are not intended to be financial advice. It does not constitute a recommendation to buy or sell any stock, and does not take account of your objectives, or your financial situation. We aim to bring you long-term focused analysis driven by fundamental data. Note that our analysis may not factor in the latest price-sensitive company announcements or qualitative material. Simply Wall St has no position in any stocks mentioned.
Have feedback on this article? Concerned about the content? Get in touch with us directly. Alternatively, email editorial-team@simplywallst.com