
 Nasdaq
 华尔街日报
华尔街日报Does LTC Properties Still Offer Value After Recent Capital Recycling and Flat 2026 Share Price?
- Wondering if LTC Properties is quietly undervalued or just fairly priced for its steady dividends and niche in senior housing? You are not alone if you are trying to figure out whether it still has room to run from here.
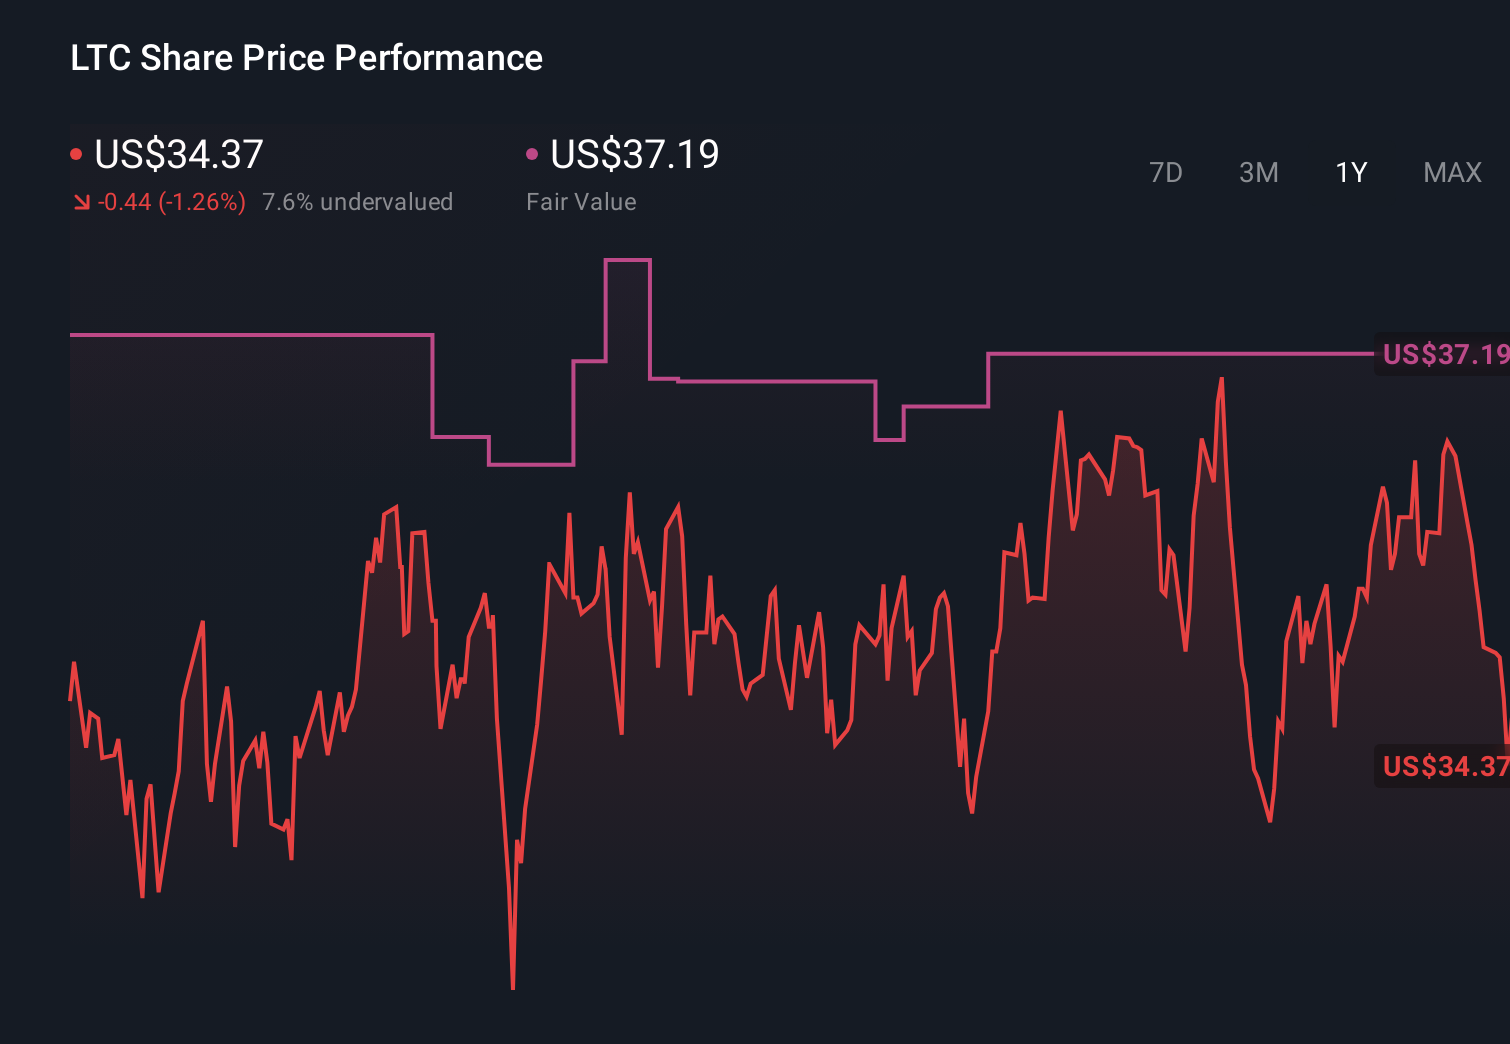
- The stock is up 7.9% over the last year but has been basically flat year to date at 0.0%, with a small 1.4% gain in the past week partly offsetting a 1.5% dip over the last month.
- Recent headlines have focused on LTC steadily recycling capital into newer senior housing and skilled nursing assets while continuing to prune underperforming properties. This helps explain the stock's relatively resilient performance. Investors are also watching how management balances acquisitions with maintaining a conservative balance sheet as financing costs remain elevated.
- On our framework, LTC scores a valuation check score of 2 out of 6, suggesting only limited signs of outright undervaluation. Next we will break down what that means across different valuation approaches before finishing with a more holistic way to think about what the stock is really worth.
LTC Properties scores just 2/6 on our valuation checks. See what other red flags we found in the full valuation breakdown.
Approach 1: LTC Properties Discounted Cash Flow (DCF) Analysis
The Discounted Cash Flow approach estimates what LTC Properties is worth today by projecting its adjusted funds from operations into the future and discounting those cash flows back to the present.
LTC generated about $123.4 million in free cash flow over the last twelve months, and analysts expect this to rise to roughly $168.5 million by 2028. Beyond the explicit analyst horizon, cash flows out to 2035 are extrapolated, with projections continuing to edge higher each year based on more moderate assumed growth rates.
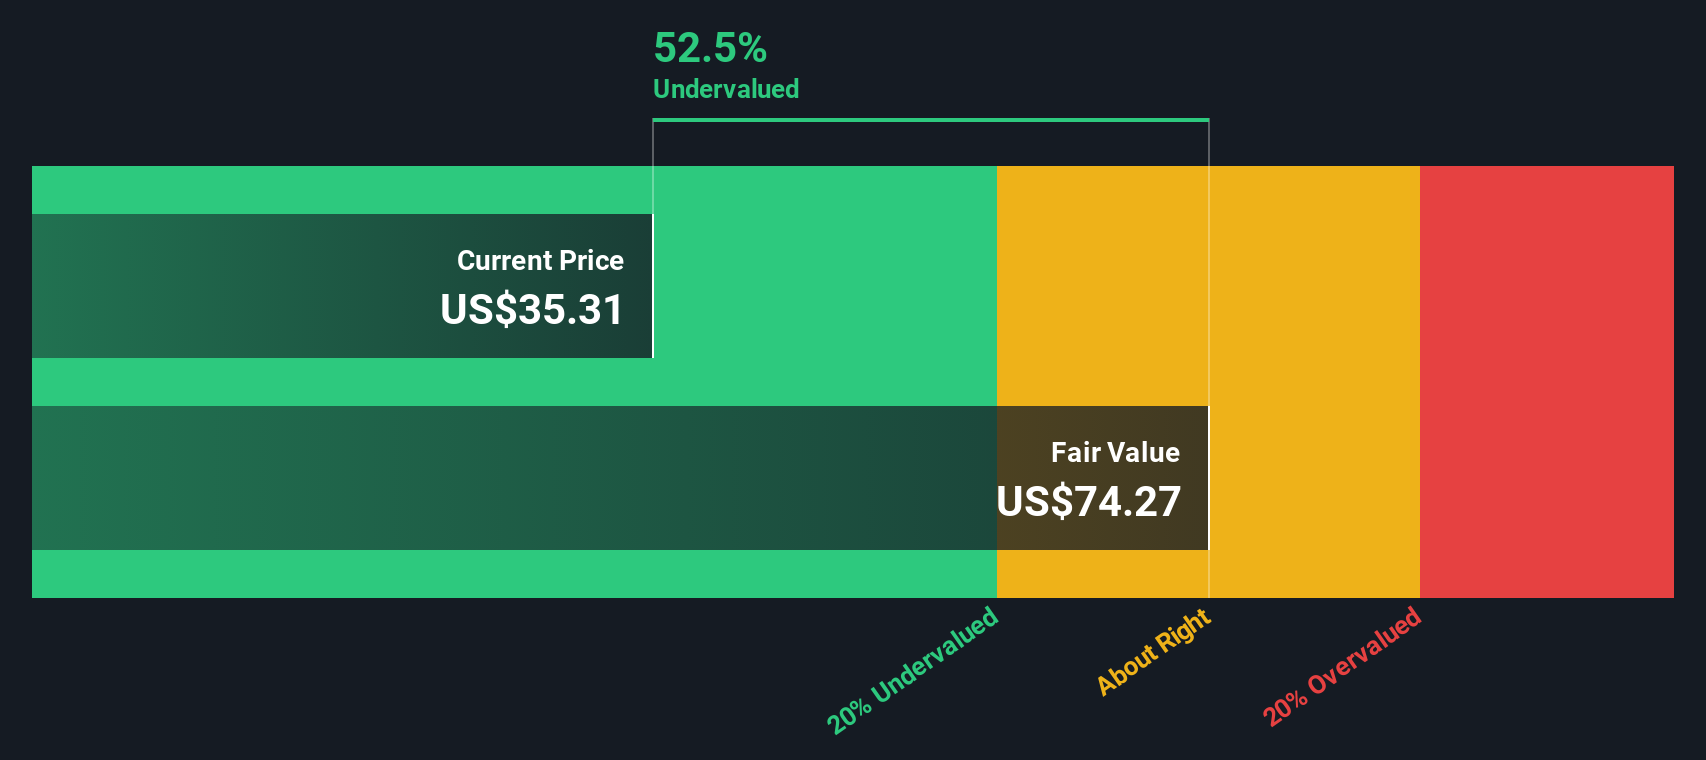
When all of these forecasts are combined, the model arrives at an intrinsic value of about $77.55 per share. Compared with the current market price, this implies the stock is trading at roughly a 55.3% discount to its calculated fair value, indicating that investors are paying substantially less than what these cash flow projections would justify.
This is a clearly supportive signal for value oriented investors, although it still depends on LTC meeting those future cash flow expectations.
Result: UNDERVALUED
Our Discounted Cash Flow (DCF) analysis suggests LTC Properties is undervalued by 55.3%. Track this in your watchlist or portfolio, or discover 875 more undervalued stocks based on cash flows.
Approach 2: LTC Properties Price vs Earnings
For profitable companies like LTC Properties, the price to earnings (PE) ratio is a useful yardstick because it links what investors pay for each share directly to the company’s current earnings power. In broad terms, higher expected growth and lower perceived risk can justify a higher “normal” PE, while slower growth or higher risk usually call for a lower multiple.
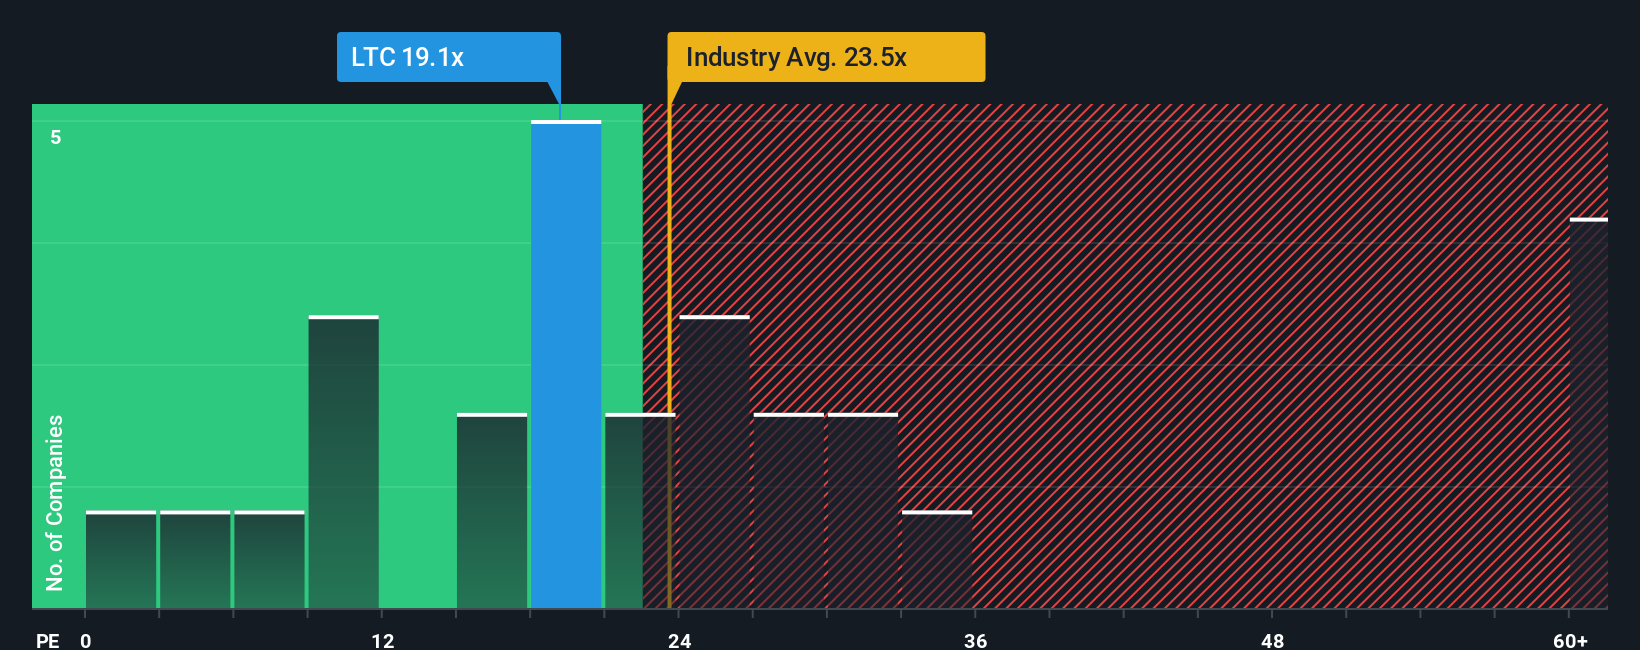
LTC currently trades on a PE of about 49.67x, which is well above both the Health Care REITs industry average of roughly 25.85x and the broader peer group average of about 28.13x. To get a more tailored view, Simply Wall St’s proprietary Fair Ratio model estimates what PE LTC should trade on, given its earnings growth outlook, profitability, industry, size and risk profile. For LTC, this Fair Ratio comes out at around 44.17x, suggesting the shares are priced somewhat richer than those fundamentals alone would imply.
Because the Fair Ratio explicitly incorporates growth, risks, profit margins, industry dynamics and market cap, it provides a more nuanced benchmark than simple peer or industry comparisons. On that basis, LTC’s current 49.67x PE sits meaningfully above the 44.17x Fair Ratio, pointing to a stock that looks modestly expensive on earnings.
Result: OVERVALUED
PE ratios tell one story, but what if the real opportunity lies elsewhere? Discover 1464 companies where insiders are betting big on explosive growth.
Upgrade Your Decision Making: Choose your LTC Properties Narrative
Earlier we mentioned that there is an even better way to understand valuation, so let us introduce you to Narratives, an approach that lets you tell a clear story about LTC Properties, including your assumptions for future revenue, earnings and margins, and then link that story directly to a financial forecast and a resulting fair value. Narratives are simple: you start with your view of the business and the industry (for example, how quickly modern senior housing will grow, how margins will evolve, and what PE multiple feels reasonable), the platform converts that into numbers, and you can immediately see whether your fair value suggests LTC is attractively or unattractively priced compared with today’s price. On Simply Wall St, Narratives live in the Community page, where millions of investors can create, compare and refine these story driven valuations, and they update dynamically whenever fresh news or earnings are released, so your fair value view stays in sync with reality. For LTC, one investor might build a narrative that supports a value near $43 because they see faster growth and resilient margins, while another might construct a more cautious case closer to $34 based on slower expansion and higher risks.
Do you think there's more to the story for LTC Properties? Head over to our Community to see what others are saying!
This article by Simply Wall St is general in nature. We provide commentary based on historical data and analyst forecasts only using an unbiased methodology and our articles are not intended to be financial advice. It does not constitute a recommendation to buy or sell any stock, and does not take account of your objectives, or your financial situation. We aim to bring you long-term focused analysis driven by fundamental data. Note that our analysis may not factor in the latest price-sensitive company announcements or qualitative material. Simply Wall St has no position in any stocks mentioned.
Have feedback on this article? Concerned about the content? Get in touch with us directly. Alternatively, email editorial-team@simplywallst.com