
 Nasdaq
 华尔街日报
华尔街日报Evaluating Xometry (XMTR) After Liberty Park’s Bullish Letter and Another Strong Growth Quarter
Liberty Park Capital Management’s latest investor letter put Xometry (XMTR) back in the spotlight after another better than expected quarter, with enterprise growth above 40% and marketplace driven revenue up 28% year over year.
See our latest analysis for Xometry.
That optimism has been echoed in the market, with Xometry’s 90 day share price return of 18.98% and 1 year total shareholder return of 45.28% suggesting momentum is building as investors reassess its growth potential.
If this kind of momentum has your attention, it could be a good moment to explore other high growth tech and AI names through high growth tech and AI stocks.
Yet with shares up strongly and now sitting close to analyst targets while still trading at a steep premium to intrinsic value estimates, is Xometry a compelling entry point, or has the market already priced in tomorrow’s growth?
Most Popular Narrative Narrative: 4.1% Undervalued
With Xometry last closing at $62.76 against a narrative fair value of about $65.44, the story leans toward modest upside from here.
The rapid deployment of AI and machine learning across pricing, supplier selection, and workflow automation is substantially improving efficiency, optimizing gross margin, and providing significant operating leverage, positioning the company for margin expansion and improving EBITDA.
Curious how this efficiency push translates into that higher valuation anchor? The narrative leans on bold revenue compounding, margin lift, and a punchy future earnings multiple. Want to see exactly how those moving parts stack up over time?
Result: Fair Value of $65.44 (UNDERVALUED)
Have a read of the narrative in full and understand what's behind the forecasts.
However, lingering questions around sustained profitability and intensifying digital manufacturing competition could quickly challenge the upbeat growth and valuation narrative around Xometry.
Find out about the key risks to this Xometry narrative.
Another View: Rich Multiples, Different Story
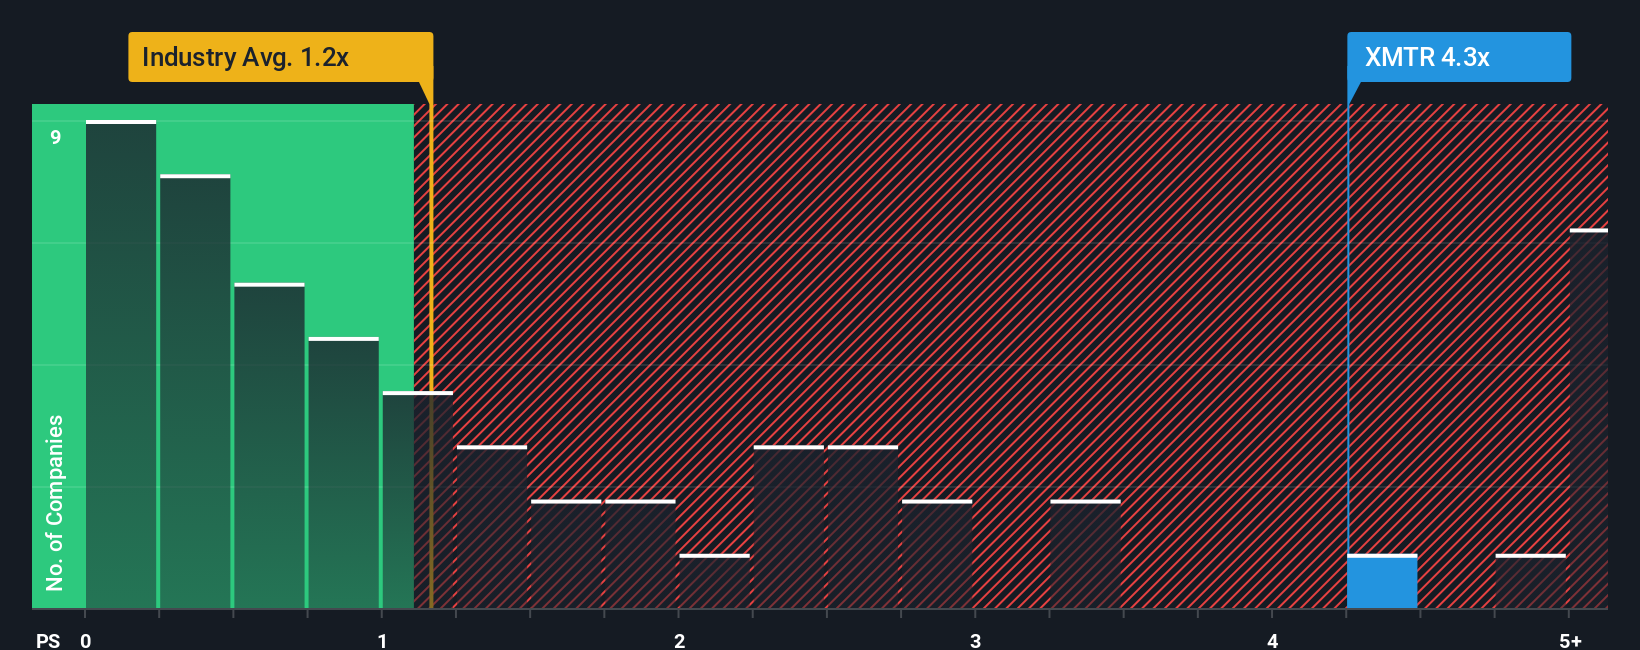
Step away from the narrative fair value, and the picture looks tougher. On a price-to-sales ratio of 5 times, Xometry trades well above the US Trade Distributors industry at 1.2 times, peers at 1.4 times, and even our fair ratio of 3.6 times, which raises clear valuation risk if sentiment cools.
See what the numbers say about this price — find out in our valuation breakdown.
Build Your Own Xometry Narrative
If our take does not line up with yours, dive into the numbers yourself and craft a personalized Xometry storyline in minutes: Do it your way.
A great starting point for your Xometry research is our analysis highlighting 1 key reward and 1 important warning sign that could impact your investment decision.
Ready for more high conviction ideas?
Before you move on, lock in your next potential winner by using the Simply Wall St Screener to pinpoint data backed opportunities other investors may overlook.
- Target future breakthroughs by assessing these 25 AI penny stocks positioned at the heart of intelligent automation, data infrastructure, and real world software applications.
- Secure dependable income streams by focusing on these 14 dividend stocks with yields > 3% that combine attractive yields with resilient business models and cash flow strength.
- Aim for asymmetric upside by reviewing these 3571 penny stocks with strong financials where solid fundamentals and improving momentum can create powerful re rating potential.
This article by Simply Wall St is general in nature. We provide commentary based on historical data and analyst forecasts only using an unbiased methodology and our articles are not intended to be financial advice. It does not constitute a recommendation to buy or sell any stock, and does not take account of your objectives, or your financial situation. We aim to bring you long-term focused analysis driven by fundamental data. Note that our analysis may not factor in the latest price-sensitive company announcements or qualitative material. Simply Wall St has no position in any stocks mentioned.
Have feedback on this article? Concerned about the content? Get in touch with us directly. Alternatively, email editorial-team@simplywallst.com