
 Nasdaq
 华尔街日报
华尔街日报Calculating The Intrinsic Value Of Oil India Limited (NSE:OIL)
Key Insights
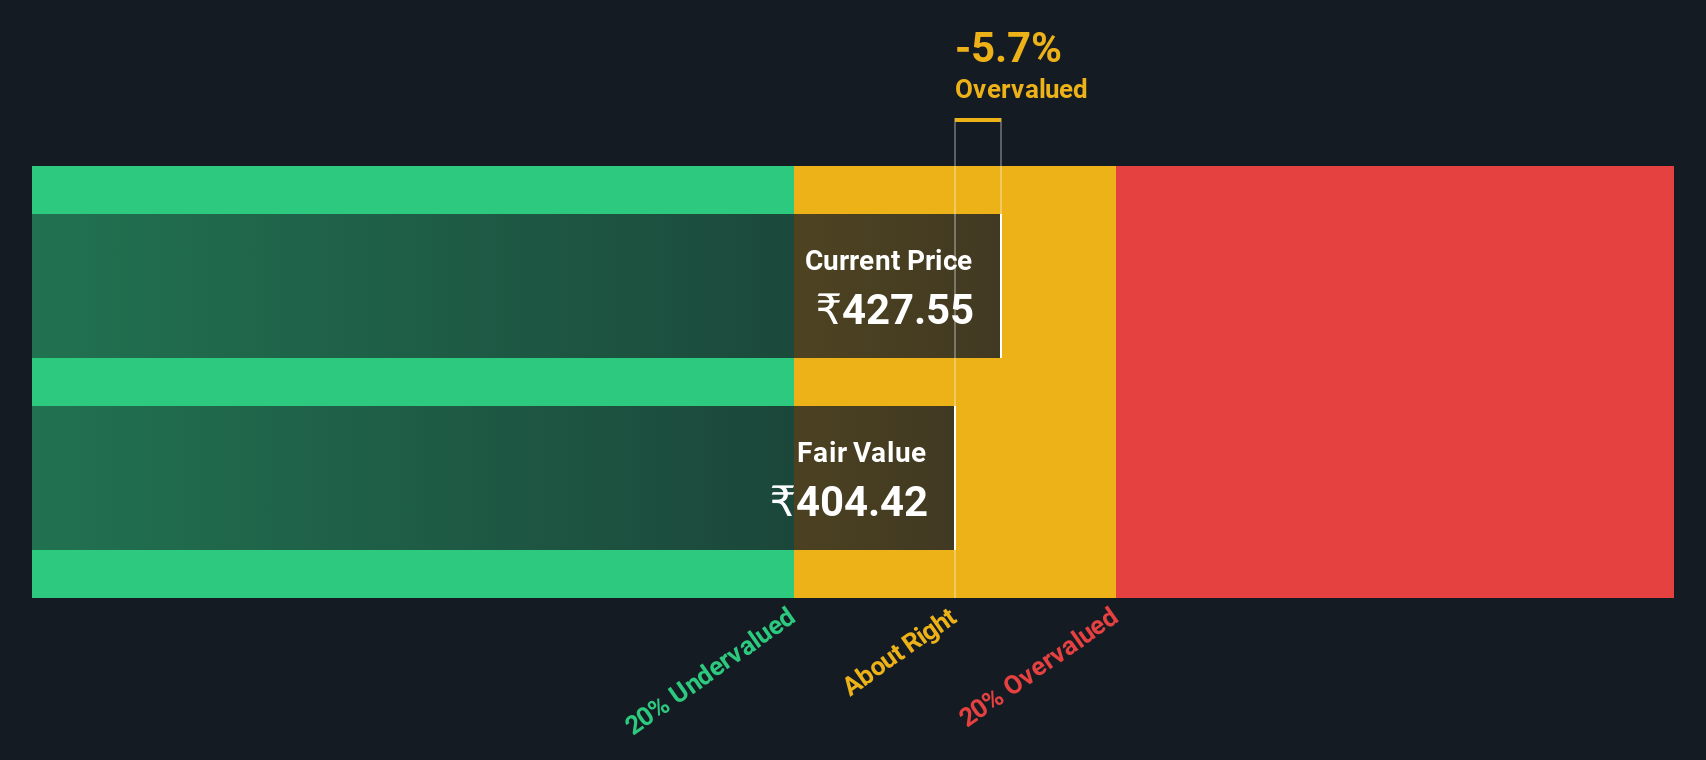
- Oil India's estimated fair value is ₹404 based on 2 Stage Free Cash Flow to Equity
- Oil India's ₹428 share price indicates it is trading at similar levels as its fair value estimate
- Our fair value estimate is 20% lower than Oil India's analyst price target of ₹506
Today we'll do a simple run through of a valuation method used to estimate the attractiveness of Oil India Limited (NSE:OIL) as an investment opportunity by projecting its future cash flows and then discounting them to today's value. This will be done using the Discounted Cash Flow (DCF) model. Don't get put off by the jargon, the math behind it is actually quite straightforward.
We would caution that there are many ways of valuing a company and, like the DCF, each technique has advantages and disadvantages in certain scenarios. If you still have some burning questions about this type of valuation, take a look at the Simply Wall St analysis model.
Is Oil India Fairly Valued?
We're using the 2-stage growth model, which simply means we take in account two stages of company's growth. In the initial period the company may have a higher growth rate and the second stage is usually assumed to have a stable growth rate. To begin with, we have to get estimates of the next ten years of cash flows. Where possible we use analyst estimates, but when these aren't available we extrapolate the previous free cash flow (FCF) from the last estimate or reported value. We assume companies with shrinking free cash flow will slow their rate of shrinkage, and that companies with growing free cash flow will see their growth rate slow, over this period. We do this to reflect that growth tends to slow more in the early years than it does in later years.
A DCF is all about the idea that a dollar in the future is less valuable than a dollar today, so we discount the value of these future cash flows to their estimated value in today's dollars:
10-year free cash flow (FCF) forecast
| 2026 | 2027 | 2028 | 2029 | 2030 | 2031 | 2032 | 2033 | 2034 | 2035 | |
| Levered FCF (₹, Millions) | ₹39.4b | ₹43.7b | ₹46.4b | ₹49.2b | ₹52.3b | ₹55.6b | ₹59.2b | ₹63.1b | ₹67.3b | ₹71.8b |
| Growth Rate Estimate Source | Analyst x6 | Analyst x6 | Analyst x7 | Est @ 5.97% | Est @ 6.21% | Est @ 6.39% | Est @ 6.51% | Est @ 6.59% | Est @ 6.65% | Est @ 6.69% |
| Present Value (₹, Millions) Discounted @ 13% | ₹34.9k | ₹34.3k | ₹32.3k | ₹30.3k | ₹28.5k | ₹26.9k | ₹25.4k | ₹24.0k | ₹22.7k | ₹21.4k |
("Est" = FCF growth rate estimated by Simply Wall St)
Present Value of 10-year Cash Flow (PVCF) = ₹281b
We now need to calculate the Terminal Value, which accounts for all the future cash flows after this ten year period. For a number of reasons a very conservative growth rate is used that cannot exceed that of a country's GDP growth. In this case we have used the 5-year average of the 10-year government bond yield (6.8%) to estimate future growth. In the same way as with the 10-year 'growth' period, we discount future cash flows to today's value, using a cost of equity of 13%.
Terminal Value (TV)= FCF2035 × (1 + g) ÷ (r – g) = ₹72b× (1 + 6.8%) ÷ (13%– 6.8%) = ₹1.3t
Present Value of Terminal Value (PVTV)= TV / (1 + r)10= ₹1.3t÷ ( 1 + 13%)10= ₹377b
The total value, or equity value, is then the sum of the present value of the future cash flows, which in this case is ₹658b. The last step is to then divide the equity value by the number of shares outstanding. Compared to the current share price of ₹428, the company appears around fair value at the time of writing. Valuations are imprecise instruments though, rather like a telescope - move a few degrees and end up in a different galaxy. Do keep this in mind.
Important Assumptions
The calculation above is very dependent on two assumptions. The first is the discount rate and the other is the cash flows. You don't have to agree with these inputs, I recommend redoing the calculations yourself and playing with them. The DCF also does not consider the possible cyclicality of an industry, or a company's future capital requirements, so it does not give a full picture of a company's potential performance. Given that we are looking at Oil India as potential shareholders, the cost of equity is used as the discount rate, rather than the cost of capital (or weighted average cost of capital, WACC) which accounts for debt. In this calculation we've used 13%, which is based on a levered beta of 0.813. Beta is a measure of a stock's volatility, compared to the market as a whole. We get our beta from the industry average beta of globally comparable companies, with an imposed limit between 0.8 and 2.0, which is a reasonable range for a stable business.
Check out our latest analysis for Oil India
SWOT Analysis for Oil India
- Debt is not viewed as a risk.
- Dividend is in the top 25% of dividend payers in the market.
- Earnings declined over the past year.
- Annual earnings are forecast to grow for the next 3 years.
- Good value based on P/E ratio compared to estimated Fair P/E ratio.
- Paying a dividend but company has no free cash flows.
- Annual earnings are forecast to grow slower than the Indian market.
Moving On:
Although the valuation of a company is important, it shouldn't be the only metric you look at when researching a company. It's not possible to obtain a foolproof valuation with a DCF model. Rather it should be seen as a guide to "what assumptions need to be true for this stock to be under/overvalued?" For instance, if the terminal value growth rate is adjusted slightly, it can dramatically alter the overall result. For Oil India, we've compiled three additional elements you should look at:
- Risks: For example, we've discovered 1 warning sign for Oil India that you should be aware of before investing here.
- Future Earnings: How does OIL's growth rate compare to its peers and the wider market? Dig deeper into the analyst consensus number for the upcoming years by interacting with our free analyst growth expectation chart.
- Other High Quality Alternatives: Do you like a good all-rounder? Explore our interactive list of high quality stocks to get an idea of what else is out there you may be missing!
PS. The Simply Wall St app conducts a discounted cash flow valuation for every stock on the NSEI every day. If you want to find the calculation for other stocks just search here.
Have feedback on this article? Concerned about the content? Get in touch with us directly. Alternatively, email editorial-team (at) simplywallst.com.
This article by Simply Wall St is general in nature. We provide commentary based on historical data and analyst forecasts only using an unbiased methodology and our articles are not intended to be financial advice. It does not constitute a recommendation to buy or sell any stock, and does not take account of your objectives, or your financial situation. We aim to bring you long-term focused analysis driven by fundamental data. Note that our analysis may not factor in the latest price-sensitive company announcements or qualitative material. Simply Wall St has no position in any stocks mentioned.