
 Nasdaq
 华尔街日报
华尔街日报Here's Why Sankyu (TSE:9065) Can Manage Its Debt Responsibly
David Iben put it well when he said, 'Volatility is not a risk we care about. What we care about is avoiding the permanent loss of capital.' So it might be obvious that you need to consider debt, when you think about how risky any given stock is, because too much debt can sink a company. Importantly, Sankyu Inc. (TSE:9065) does carry debt. But the real question is whether this debt is making the company risky.
What Risk Does Debt Bring?
Debt and other liabilities become risky for a business when it cannot easily fulfill those obligations, either with free cash flow or by raising capital at an attractive price. Ultimately, if the company can't fulfill its legal obligations to repay debt, shareholders could walk away with nothing. However, a more common (but still painful) scenario is that it has to raise new equity capital at a low price, thus permanently diluting shareholders. Having said that, the most common situation is where a company manages its debt reasonably well - and to its own advantage. The first step when considering a company's debt levels is to consider its cash and debt together.
What Is Sankyu's Debt?
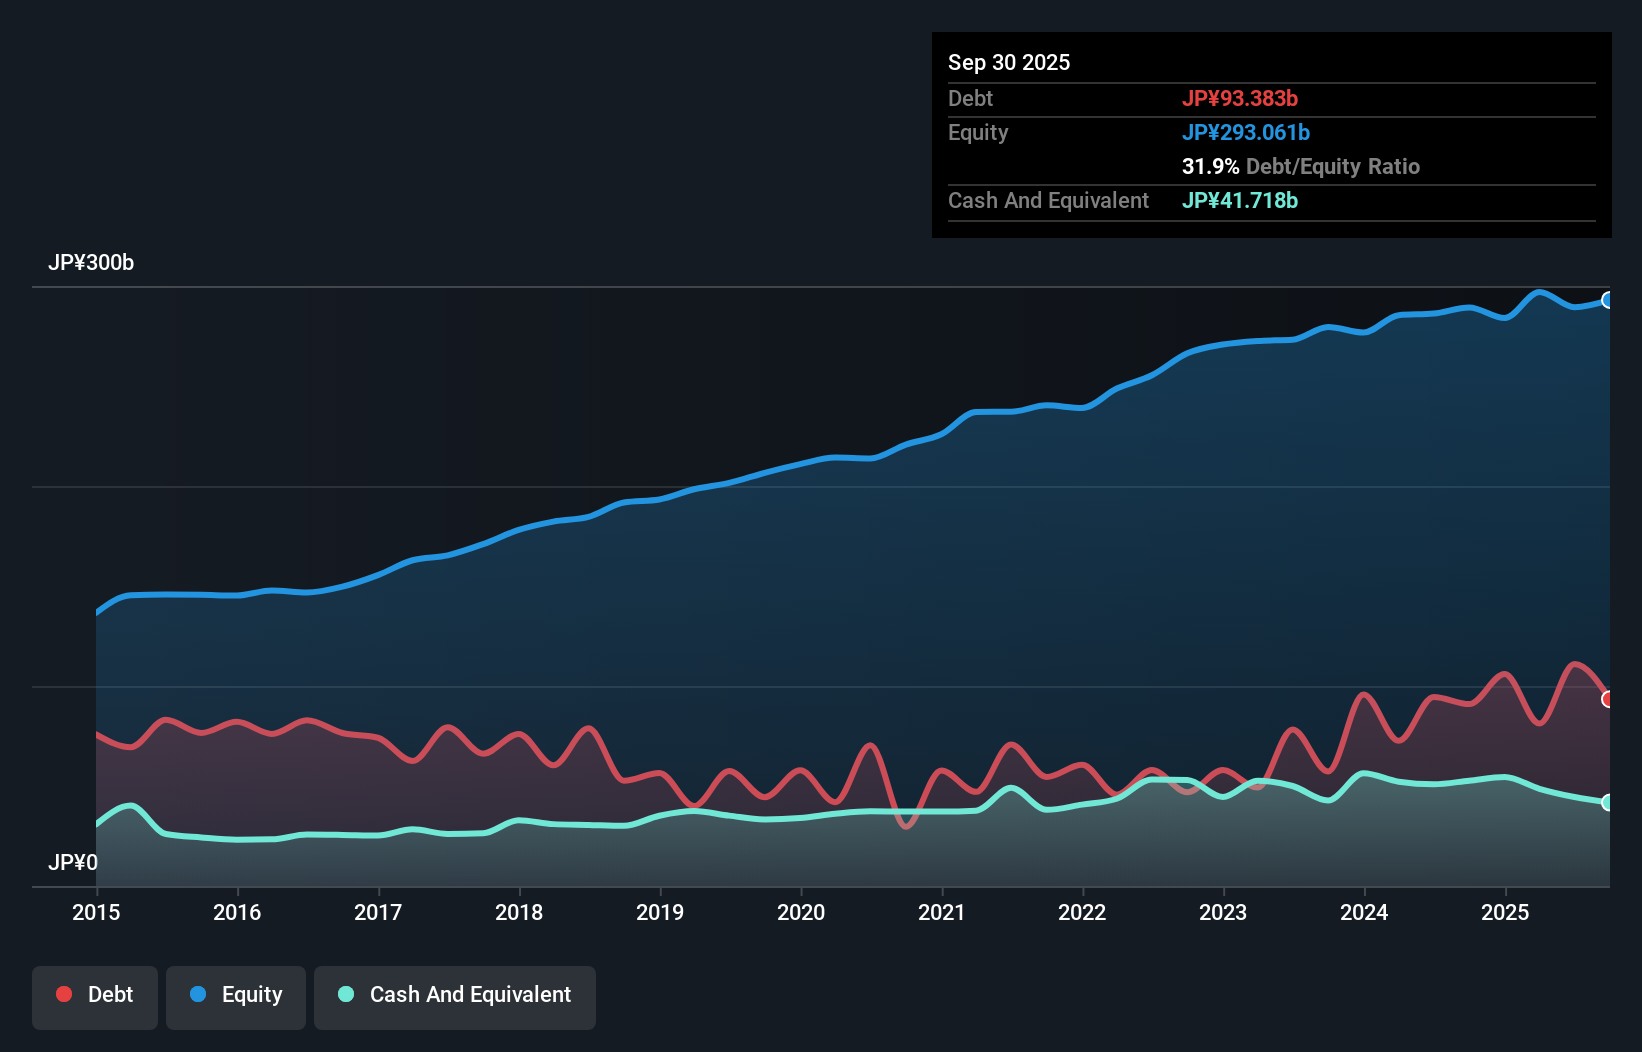
As you can see below, Sankyu had JP¥93.4b of debt, at September 2025, which is about the same as the year before. You can click the chart for greater detail. However, because it has a cash reserve of JP¥41.7b, its net debt is less, at about JP¥51.7b.
How Healthy Is Sankyu's Balance Sheet?
According to the last reported balance sheet, Sankyu had liabilities of JP¥138.5b due within 12 months, and liabilities of JP¥101.7b due beyond 12 months. Offsetting these obligations, it had cash of JP¥41.7b as well as receivables valued at JP¥208.4b due within 12 months. So it can boast JP¥9.94b more liquid assets than total liabilities.
This short term liquidity is a sign that Sankyu could probably pay off its debt with ease, as its balance sheet is far from stretched.
See our latest analysis for Sankyu
We use two main ratios to inform us about debt levels relative to earnings. The first is net debt divided by earnings before interest, tax, depreciation, and amortization (EBITDA), while the second is how many times its earnings before interest and tax (EBIT) covers its interest expense (or its interest cover, for short). The advantage of this approach is that we take into account both the absolute quantum of debt (with net debt to EBITDA) and the actual interest expenses associated with that debt (with its interest cover ratio).
Sankyu has a low debt to EBITDA ratio of only 0.80. And remarkably, despite having net debt, it actually received more in interest over the last twelve months than it had to pay. So there's no doubt this company can take on debt while staying cool as a cucumber. And we also note warmly that Sankyu grew its EBIT by 16% last year, making its debt load easier to handle. When analysing debt levels, the balance sheet is the obvious place to start. But it is future earnings, more than anything, that will determine Sankyu's ability to maintain a healthy balance sheet going forward. So if you want to see what the professionals think, you might find this free report on analyst profit forecasts to be interesting.
Finally, while the tax-man may adore accounting profits, lenders only accept cold hard cash. So the logical step is to look at the proportion of that EBIT that is matched by actual free cash flow. Looking at the most recent three years, Sankyu recorded free cash flow of 30% of its EBIT, which is weaker than we'd expect. That weak cash conversion makes it more difficult to handle indebtedness.
Our View
The good news is that Sankyu's demonstrated ability to cover its interest expense with its EBIT delights us like a fluffy puppy does a toddler. But truth be told we feel its conversion of EBIT to free cash flow does undermine this impression a bit. Taking all this data into account, it seems to us that Sankyu takes a pretty sensible approach to debt. That means they are taking on a bit more risk, in the hope of boosting shareholder returns. Over time, share prices tend to follow earnings per share, so if you're interested in Sankyu, you may well want to click here to check an interactive graph of its earnings per share history.
At the end of the day, it's often better to focus on companies that are free from net debt. You can access our special list of such companies (all with a track record of profit growth). It's free.
Have feedback on this article? Concerned about the content? Get in touch with us directly. Alternatively, email editorial-team (at) simplywallst.com.
This article by Simply Wall St is general in nature. We provide commentary based on historical data and analyst forecasts only using an unbiased methodology and our articles are not intended to be financial advice. It does not constitute a recommendation to buy or sell any stock, and does not take account of your objectives, or your financial situation. We aim to bring you long-term focused analysis driven by fundamental data. Note that our analysis may not factor in the latest price-sensitive company announcements or qualitative material. Simply Wall St has no position in any stocks mentioned.