
 Nasdaq
 华尔街日报
华尔街日报Despite recent sales, China East Education Holdings Limited (HKG:667) insiders own 71% shares but recent downturn may have set them back
Key Insights
- Significant insider control over China East Education Holdings implies vested interests in company growth
- 55% of the business is held by the top 2 shareholders
- Insiders have sold recently
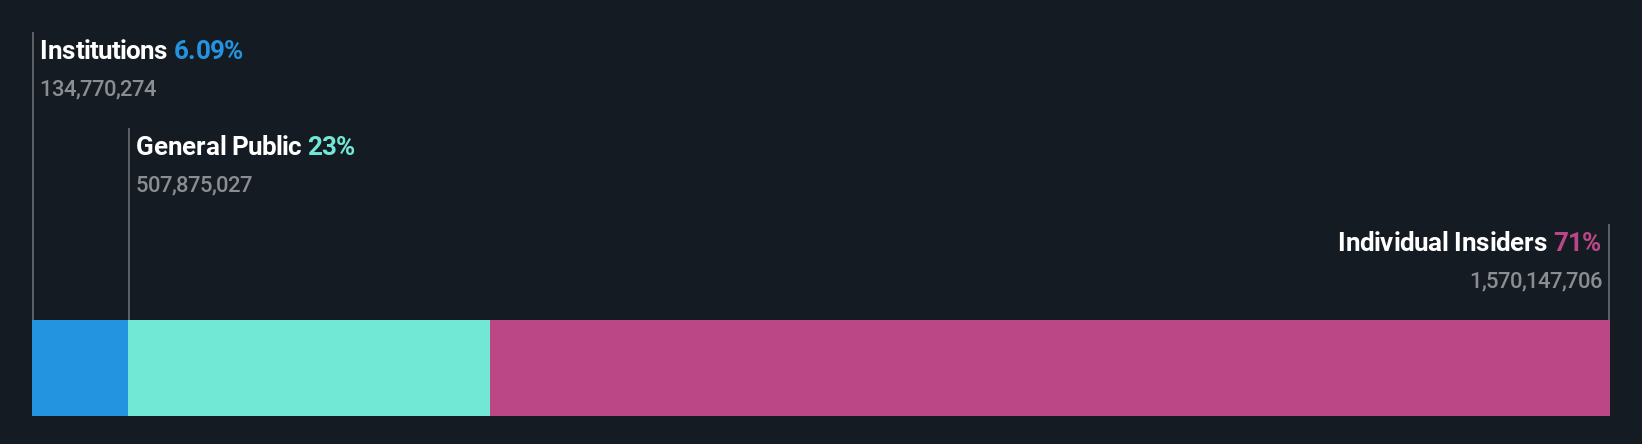
If you want to know who really controls China East Education Holdings Limited (HKG:667), then you'll have to look at the makeup of its share registry. With 71% stake, individual insiders possess the maximum shares in the company. That is, the group stands to benefit the most if the stock rises (or lose the most if there is a downturn).
Even though insiders have sold shares recently, the group owns the most numbers of shares in the company. As a result, the group bore the brunt of last week’s HK$553m market cap loss.
Let's delve deeper into each type of owner of China East Education Holdings, beginning with the chart below.
See our latest analysis for China East Education Holdings
What Does The Institutional Ownership Tell Us About China East Education Holdings?
Institutions typically measure themselves against a benchmark when reporting to their own investors, so they often become more enthusiastic about a stock once it's included in a major index. We would expect most companies to have some institutions on the register, especially if they are growing.
China East Education Holdings already has institutions on the share registry. Indeed, they own a respectable stake in the company. This implies the analysts working for those institutions have looked at the stock and they like it. But just like anyone else, they could be wrong. It is not uncommon to see a big share price drop if two large institutional investors try to sell out of a stock at the same time. So it is worth checking the past earnings trajectory of China East Education Holdings, (below). Of course, keep in mind that there are other factors to consider, too.

We note that hedge funds don't have a meaningful investment in China East Education Holdings. Our data shows that Junbao Wu is the largest shareholder with 33% of shares outstanding. Meanwhile, the second and third largest shareholders, hold 22% and 16%, of the shares outstanding, respectively. Two of the top three shareholders happen to be Top Key Executive and Vice Chairman, respectively. That is, insiders feature higher up in the heirarchy of the company's top shareholders.
A more detailed study of the shareholder registry showed us that 2 of the top shareholders have a considerable amount of ownership in the company, via their 55% stake.
Researching institutional ownership is a good way to gauge and filter a stock's expected performance. The same can be achieved by studying analyst sentiments. There are plenty of analysts covering the stock, so it might be worth seeing what they are forecasting, too.
Insider Ownership Of China East Education Holdings
While the precise definition of an insider can be subjective, almost everyone considers board members to be insiders. The company management answer to the board and the latter should represent the interests of shareholders. Notably, sometimes top-level managers are on the board themselves.
I generally consider insider ownership to be a good thing. However, on some occasions it makes it more difficult for other shareholders to hold the board accountable for decisions.
Our most recent data indicates that insiders own the majority of China East Education Holdings Limited. This means they can collectively make decisions for the company. Given it has a market cap of HK$15b, that means insiders have a whopping HK$11b worth of shares in their own names. It is good to see this level of investment. You can check here to see if those insiders have been selling any of their shares.
General Public Ownership
The general public, who are usually individual investors, hold a 23% stake in China East Education Holdings. This size of ownership, while considerable, may not be enough to change company policy if the decision is not in sync with other large shareholders.
Next Steps:
While it is well worth considering the different groups that own a company, there are other factors that are even more important. Case in point: We've spotted 2 warning signs for China East Education Holdings you should be aware of.
But ultimately it is the future, not the past, that will determine how well the owners of this business will do. Therefore we think it advisable to take a look at this free report showing whether analysts are predicting a brighter future.
NB: Figures in this article are calculated using data from the last twelve months, which refer to the 12-month period ending on the last date of the month the financial statement is dated. This may not be consistent with full year annual report figures.
Have feedback on this article? Concerned about the content? Get in touch with us directly. Alternatively, email editorial-team (at) simplywallst.com.
This article by Simply Wall St is general in nature. We provide commentary based on historical data and analyst forecasts only using an unbiased methodology and our articles are not intended to be financial advice. It does not constitute a recommendation to buy or sell any stock, and does not take account of your objectives, or your financial situation. We aim to bring you long-term focused analysis driven by fundamental data. Note that our analysis may not factor in the latest price-sensitive company announcements or qualitative material. Simply Wall St has no position in any stocks mentioned.