
 Nasdaq
 华尔街日报
华尔街日报Exploring Three Undiscovered Gems In The Asian Market
As global markets continue to navigate mixed economic signals, the Asian market presents intriguing opportunities, particularly within its small-cap sector. With the Russell 2000 Index showing modest gains and a broader sentiment of cautious optimism in key Asian economies like China and India, investors may find potential in identifying stocks that exhibit strong fundamentals and resilience amid these dynamic conditions.
Top 10 Undiscovered Gems With Strong Fundamentals In Asia
| Name | Debt To Equity | Revenue Growth | Earnings Growth | Health Rating |
|---|---|---|---|---|
| Hong Tai Electric Industrial | NA | 7.46% | -9.91% | ★★★★★★ |
| Tsubakimoto Kogyo | NA | 7.85% | 12.88% | ★★★★★★ |
| Central Forest Group | NA | 5.20% | 24.71% | ★★★★★★ |
| Shangri-La Hotel | NA | 33.29% | 66.13% | ★★★★★★ |
| HeBei Jinniu Chemical IndustryLtd | NA | 1.60% | 14.67% | ★★★★★★ |
| Otec | 8.45% | 6.58% | 18.86% | ★★★★★☆ |
| KinjiroLtd | 19.52% | 9.13% | 29.10% | ★★★★★☆ |
| Nippon Ski Resort DevelopmentLtd | 53.48% | 17.41% | 59.68% | ★★★★★☆ |
| Li Ming Development Construction | 183.36% | 8.59% | 19.98% | ★★★★☆☆ |
| Qingdao Daneng Environmental Protection Equipment | 57.57% | 29.08% | 28.94% | ★★★★☆☆ |
Underneath we present a selection of stocks filtered out by our screen.
Shanghai Forest Cabin Cosmetics Group (SEHK:2657)
Simply Wall St Value Rating: ★★★★★☆
Overview: Shanghai Forest Cabin Cosmetics Group Co., Ltd. operates in the cosmetics industry, focusing on personal products, with a market capitalization of approximately HK$9.78 billion.
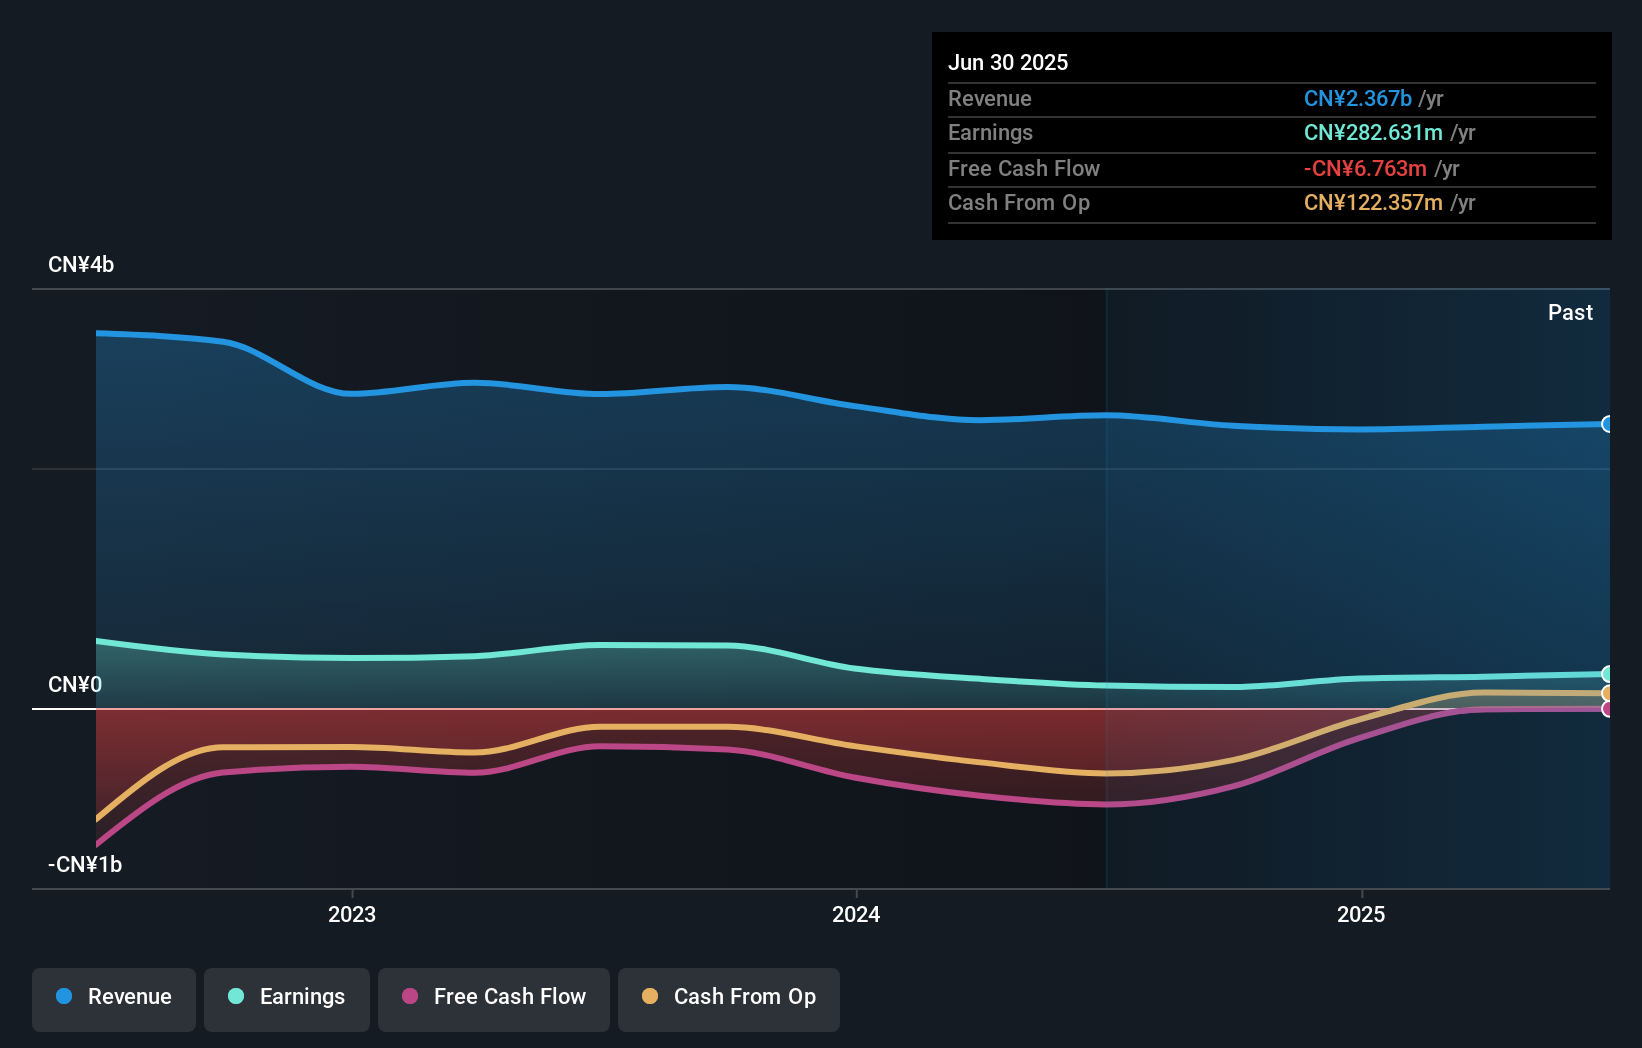
Operations: The company's primary revenue stream is from personal products, generating CN¥1.73 billion.
Shanghai Forest Cabin Cosmetics Group, a small player in the personal products sector, has shown impressive earnings growth of 108% over the past year, significantly outpacing the industry's 10%. The company's interest payments are well covered with an EBIT coverage ratio of 260 times. Despite its high level of non-cash earnings and positive free cash flow at HKD 216.20 million last year, shares remain highly illiquid. Recently filing for an IPO worth HKD 1.09 billion indicates potential expansion plans. However, it's crucial to consider these aspects alongside the company's overall financial health and market position.
- Dive into the specifics of Shanghai Forest Cabin Cosmetics Group here with our thorough health report.
Learn about Shanghai Forest Cabin Cosmetics Group's historical performance.

Kinco Automation (Shanghai)Ltd (SHSE:688160)
Simply Wall St Value Rating: ★★★★★☆
Overview: Kinco Automation (Shanghai) Co., Ltd specializes in the development, production, and sale of industrial automation standards and intelligent hardware products in China, with a market capitalization of CN¥11.05 billion.
Operations: Kinco Automation generates revenue primarily from the sale of industrial automation standards and intelligent hardware products. The company has a market capitalization of CN¥11.05 billion.
Kinco Automation, a notable player in the electronics sector, has shown impressive growth with earnings surging by 23.1% over the past year, outpacing the industry average of 9.4%. The company reported sales of CNY 508.63 million for the first nine months of 2025, up from CNY 396.28 million in the previous year, demonstrating robust revenue expansion. Despite a debt-to-equity ratio increase to 9.6% over five years, Kinco's cash exceeds its total debt and it covers interest payments comfortably. Earnings per share rose to CNY 0.52 from CNY 0.39 last year, indicating strong profitability and potential future growth prospects with forecasts suggesting a continued annual earnings increase of around 27%.

Shenzhen Leaguer (SZSE:002243)
Simply Wall St Value Rating: ★★★★☆☆
Overview: Shenzhen Leaguer Co., Ltd. specializes in designing, manufacturing, and providing services for plastic packaging solutions across sectors such as cosmetics, daily necessities, health products, and food both in China and internationally with a market cap of CN¥13.09 billion.
Operations: Shenzhen Leaguer generates revenue primarily through its plastic packaging solutions, catering to various sectors including cosmetics and food. The company has a market capitalization of CN¥13.09 billion.
Shenzhen Leaguer, a promising player in its sector, has seen its debt to equity ratio rise from 25.8% to 64.2% over five years, reflecting increased leverage. Despite this, the company's net debt to equity ratio is at a satisfactory 39.4%, indicating manageable levels of net debt relative to equity. Notably, earnings have grown by an impressive 30.6% over the past year, outpacing industry averages and showcasing strong operational performance despite a broader decline in earnings of 21.3% annually over five years. Recent amendments to company bylaws suggest active governance adjustments aimed at strategic realignment and growth optimization.
- Navigate through the intricacies of Shenzhen Leaguer with our comprehensive health report here.
Evaluate Shenzhen Leaguer's historical performance by accessing our past performance report.
Next Steps
- Click here to access our complete index of 2489 Asian Undiscovered Gems With Strong Fundamentals.
- Already own these companies? Link your portfolio to Simply Wall St and get alerts on any new warning signs to your stocks.
- Enhance your investing ability with the Simply Wall St app and enjoy free access to essential market intelligence spanning every continent.
Interested In Other Possibilities?
- Explore high-performing small cap companies that haven't yet garnered significant analyst attention.
- Fuel your portfolio with companies showing strong growth potential, backed by optimistic outlooks both from analysts and management.
- Find companies with promising cash flow potential yet trading below their fair value.
This article by Simply Wall St is general in nature. We provide commentary based on historical data and analyst forecasts only using an unbiased methodology and our articles are not intended to be financial advice. It does not constitute a recommendation to buy or sell any stock, and does not take account of your objectives, or your financial situation. We aim to bring you long-term focused analysis driven by fundamental data. Note that our analysis may not factor in the latest price-sensitive company announcements or qualitative material. Simply Wall St has no position in any stocks mentioned.
Have feedback on this article? Concerned about the content? Get in touch with us directly. Alternatively, email editorial-team@simplywallst.com