
 Nasdaq
 华尔街日报
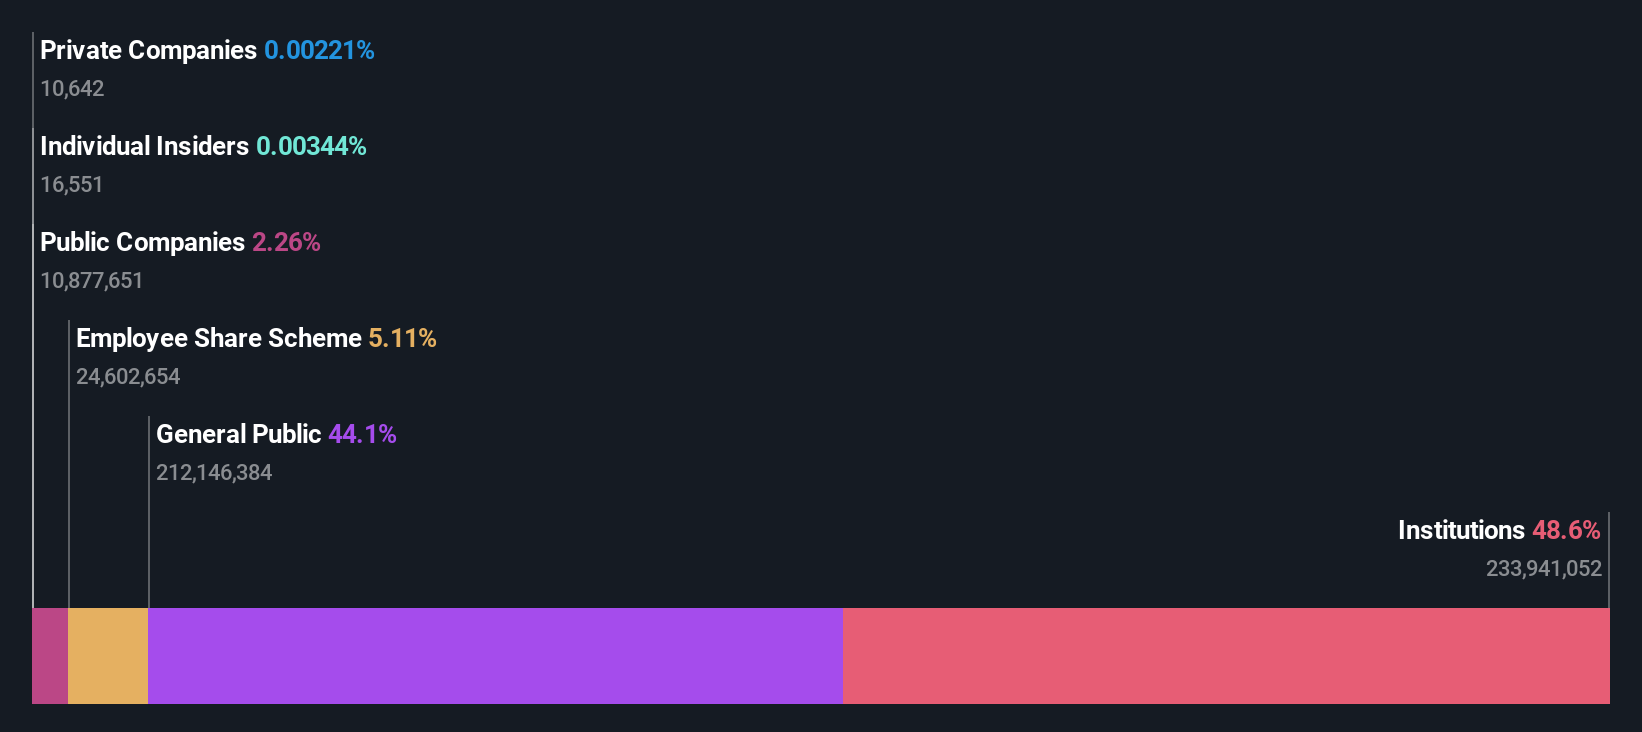
华尔街日报Shinhan Financial Group Co., Ltd. (KRX:055550) is largely controlled by institutional shareholders who own 49% of the company
Key Insights
- Institutions' substantial holdings in Shinhan Financial Group implies that they have significant influence over the company's share price
- A total of 25 investors have a majority stake in the company with 47% ownership
- Using data from analyst forecasts alongside ownership research, one can better assess the future performance of a company
If you want to know who really controls Shinhan Financial Group Co., Ltd. (KRX:055550), then you'll have to look at the makeup of its share registry. With 49% stake, institutions possess the maximum shares in the company. That is, the group stands to benefit the most if the stock rises (or lose the most if there is a downturn).
Given the vast amount of money and research capacities at their disposal, institutional ownership tends to carry a lot of weight, especially with individual investors. As a result, a sizeable amount of institutional money invested in a firm is generally viewed as a positive attribute.
In the chart below, we zoom in on the different ownership groups of Shinhan Financial Group.
Check out our latest analysis for Shinhan Financial Group
What Does The Institutional Ownership Tell Us About Shinhan Financial Group?
Many institutions measure their performance against an index that approximates the local market. So they usually pay more attention to companies that are included in major indices.
We can see that Shinhan Financial Group does have institutional investors; and they hold a good portion of the company's stock. This can indicate that the company has a certain degree of credibility in the investment community. However, it is best to be wary of relying on the supposed validation that comes with institutional investors. They too, get it wrong sometimes. When multiple institutions own a stock, there's always a risk that they are in a 'crowded trade'. When such a trade goes wrong, multiple parties may compete to sell stock fast. This risk is higher in a company without a history of growth. You can see Shinhan Financial Group's historic earnings and revenue below, but keep in mind there's always more to the story.

We note that hedge funds don't have a meaningful investment in Shinhan Financial Group. National Pension Service is currently the company's largest shareholder with 9.2% of shares outstanding. Meanwhile, the second and third largest shareholders, hold 5.6% and 5.1%, of the shares outstanding, respectively.
Our studies suggest that the top 25 shareholders collectively control less than half of the company's shares, meaning that the company's shares are widely disseminated and there is no dominant shareholder.
While it makes sense to study institutional ownership data for a company, it also makes sense to study analyst sentiments to know which way the wind is blowing. There are a reasonable number of analysts covering the stock, so it might be useful to find out their aggregate view on the future.
Insider Ownership Of Shinhan Financial Group
The definition of an insider can differ slightly between different countries, but members of the board of directors always count. Management ultimately answers to the board. However, it is not uncommon for managers to be executive board members, especially if they are a founder or the CEO.
I generally consider insider ownership to be a good thing. However, on some occasions it makes it more difficult for other shareholders to hold the board accountable for decisions.
Our most recent data indicates that insiders own less than 1% of Shinhan Financial Group Co., Ltd.. Being so large, we would not expect insiders to own a large proportion of the stock. Collectively, they own ₩1.3b of stock. It is always good to see at least some insider ownership, but it might be worth checking if those insiders have been selling.
General Public Ownership
The general public, who are usually individual investors, hold a 44% stake in Shinhan Financial Group. While this size of ownership may not be enough to sway a policy decision in their favour, they can still make a collective impact on company policies.
Next Steps:
It's always worth thinking about the different groups who own shares in a company. But to understand Shinhan Financial Group better, we need to consider many other factors. For example, we've discovered 1 warning sign for Shinhan Financial Group that you should be aware of before investing here.
But ultimately it is the future, not the past, that will determine how well the owners of this business will do. Therefore we think it advisable to take a look at this free report showing whether analysts are predicting a brighter future.
NB: Figures in this article are calculated using data from the last twelve months, which refer to the 12-month period ending on the last date of the month the financial statement is dated. This may not be consistent with full year annual report figures.
Have feedback on this article? Concerned about the content? Get in touch with us directly. Alternatively, email editorial-team (at) simplywallst.com.
This article by Simply Wall St is general in nature. We provide commentary based on historical data and analyst forecasts only using an unbiased methodology and our articles are not intended to be financial advice. It does not constitute a recommendation to buy or sell any stock, and does not take account of your objectives, or your financial situation. We aim to bring you long-term focused analysis driven by fundamental data. Note that our analysis may not factor in the latest price-sensitive company announcements or qualitative material. Simply Wall St has no position in any stocks mentioned.